
The end of blind exploration or going directly to “sweet spots” for efficient, fast and less expensive oil exploration
0-Introduction: The “Step zero” towards finally conducting a fast and productive seismic survey
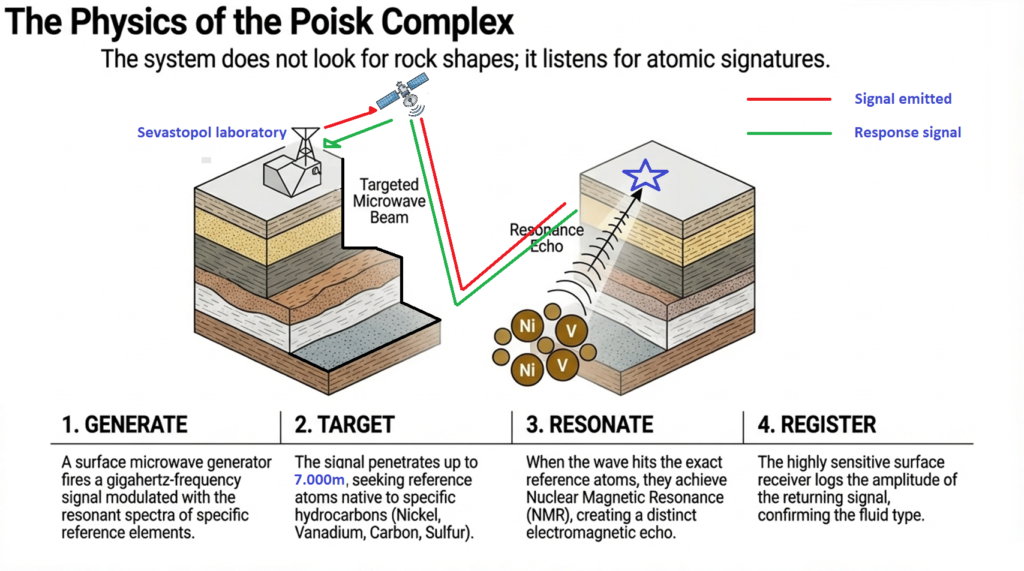
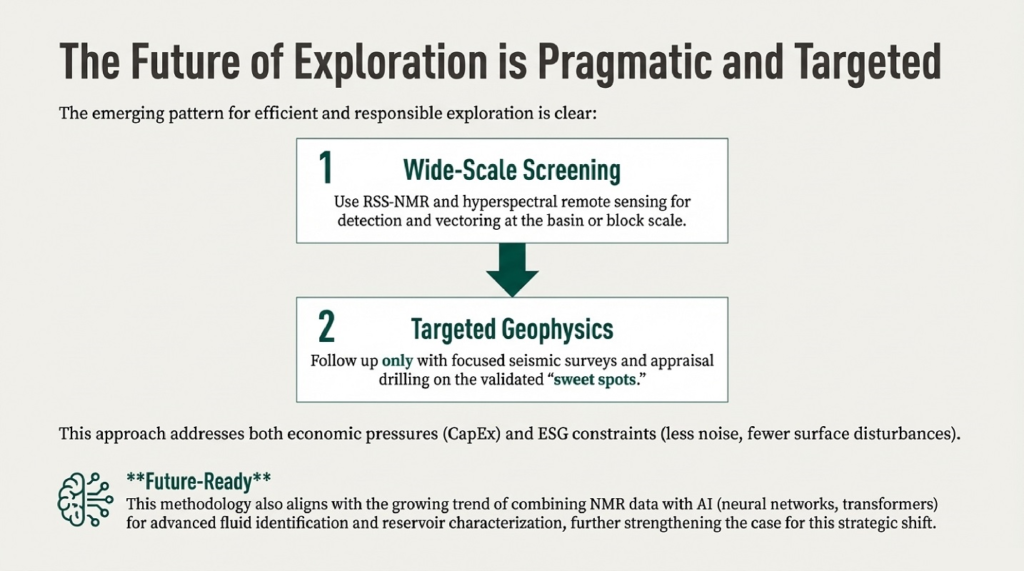
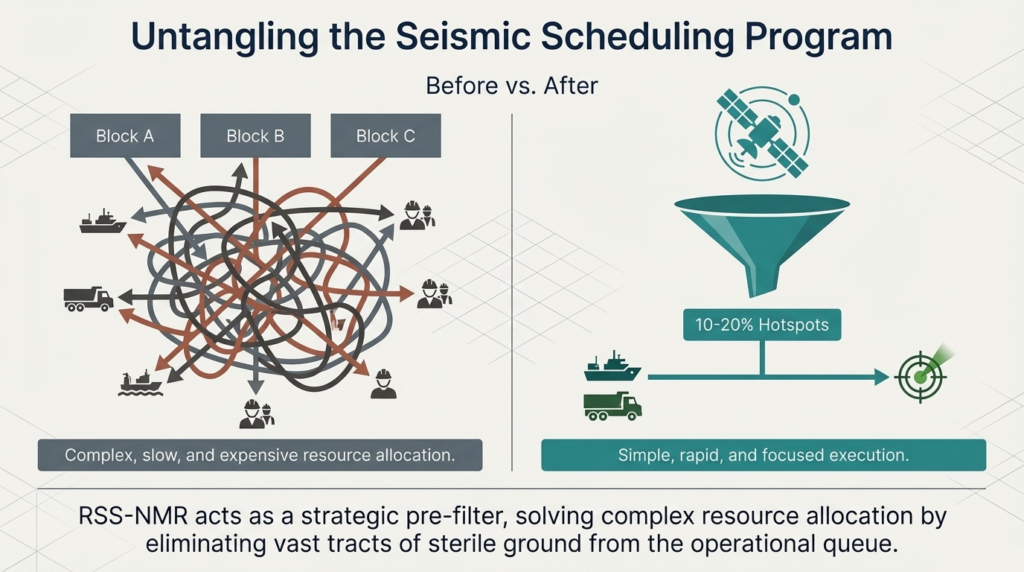
⚠️ We’ll discuss about our “Stage 0”: This is the revolution in seismic surveying thanks to satellite remote sensing. This approach allows for the direct detection of fluids such as hydrogen, oil, and gas, thus eliminating the need for systemic seismic surveys of an entire block or oil field.
⚠️ Satellite screening is an essential, even mandatory, initial step that reduces operational costs by focusing solely on areas with confirmed potential or “Sweet spots”.
⚠️ “Stage 0” allows for the identification of promising spots that yield positive results using RSS-NMR. The company can then continue with RSS-NMR technology down to the well profile or contract an other provider.
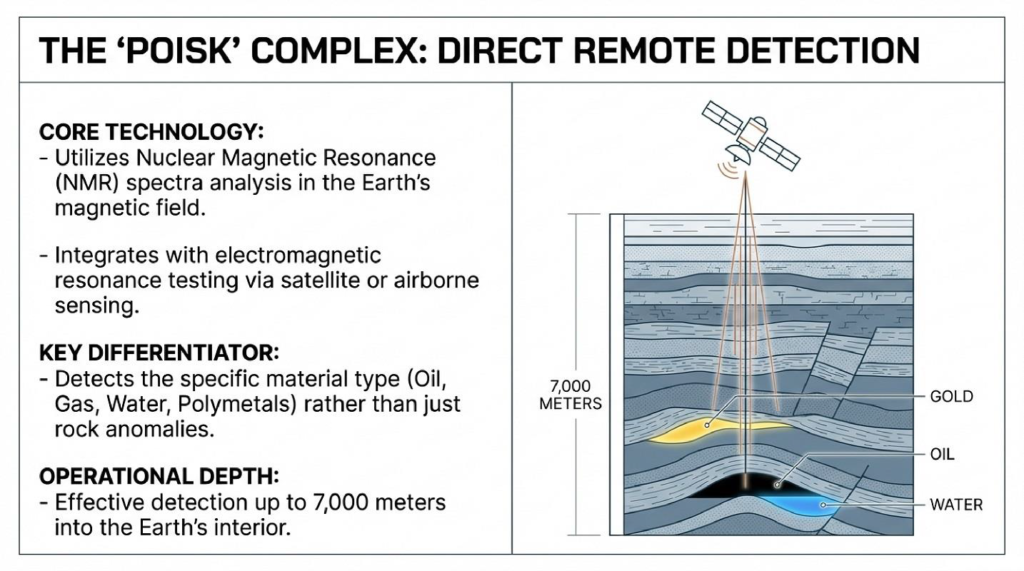
⚠️NMR-SSR should be the first step in exploring a new oil field because it allows for the direct detection of hydrocarbons down to a depth of 7 km, with 90–95% accuracy, at a significantly lower cost than conventional seismic surveys and with minimal environmental impact.
🔍Why start with NMR-SSR?
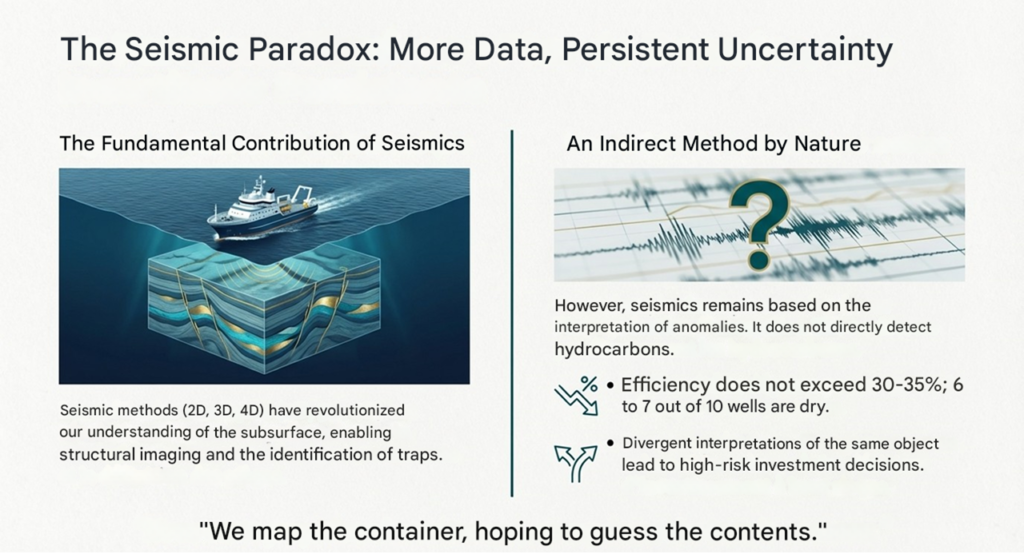
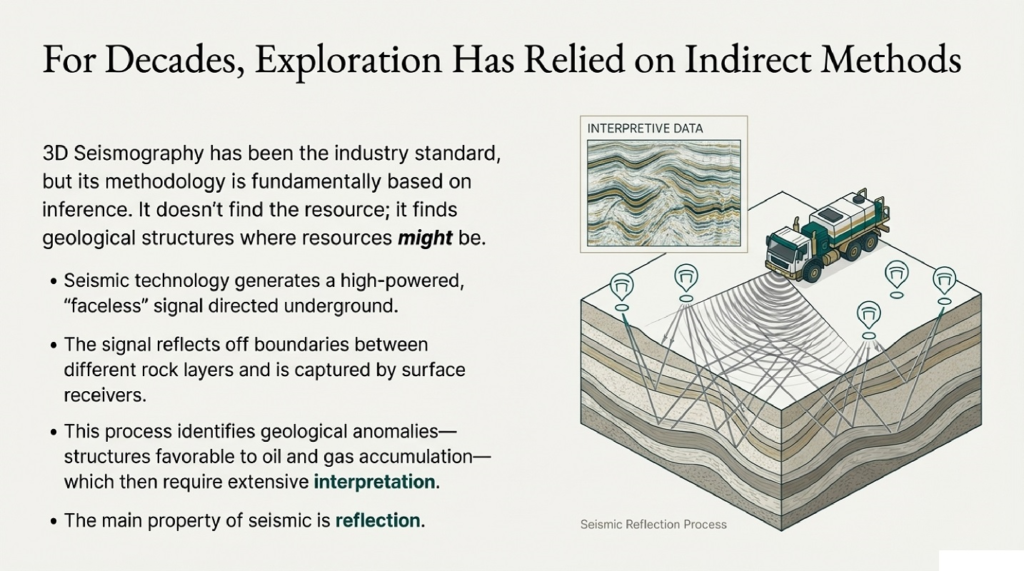
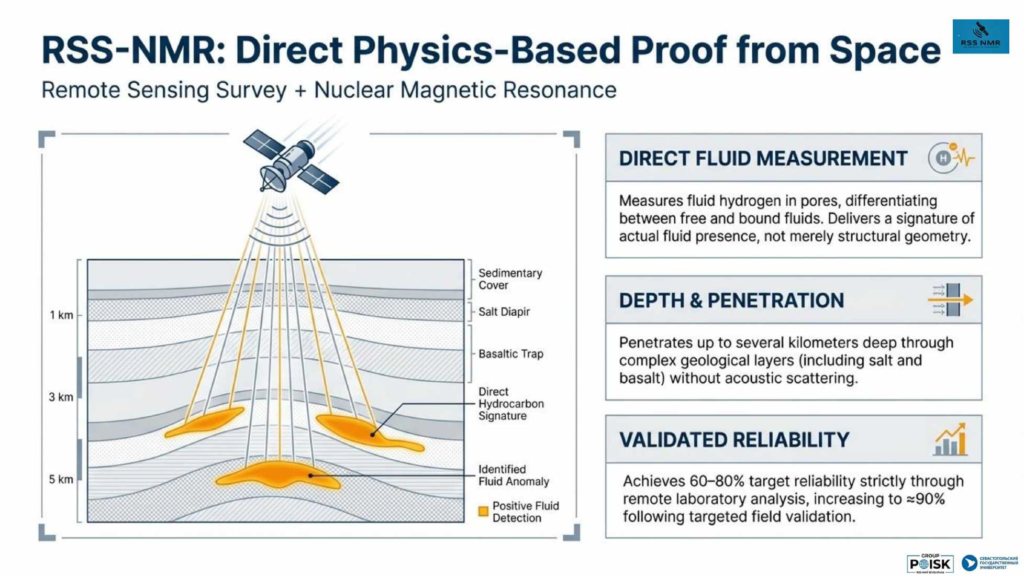
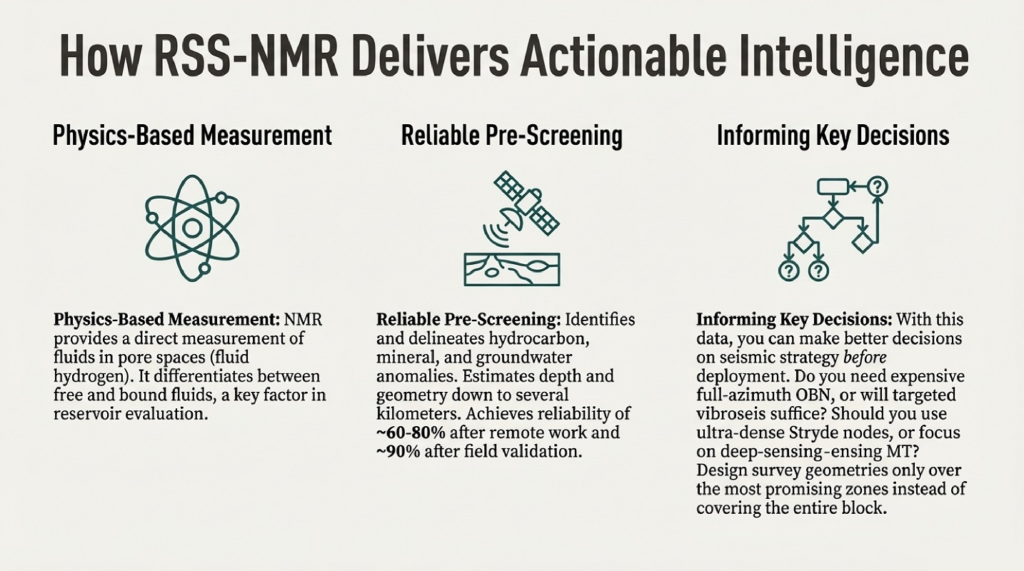
- Direct fluid detection: Unlike seismic methods that require complex interpretation, NMR-SSR sends a hydrocarbon-specific signal and captures its re-emission, providing direct evidence of the presence of oil or gas.
- Exploration depth: It can explore down to 5–7 km below the surface, covering deep reservoirs without initial drilling.
- Speed: Results are available in 30 days to 3 months, accelerating decision-making on which blocks to explore.
- Cost reduction: The cost per km² is up to ten times lower than that of conventional seismic surveys, saving tens of millions of USD by avoiding dry drilling.
- Reduced environmental impact: No need for extensive field campaigns or ecological disturbances, which is crucial in sensitive areas.
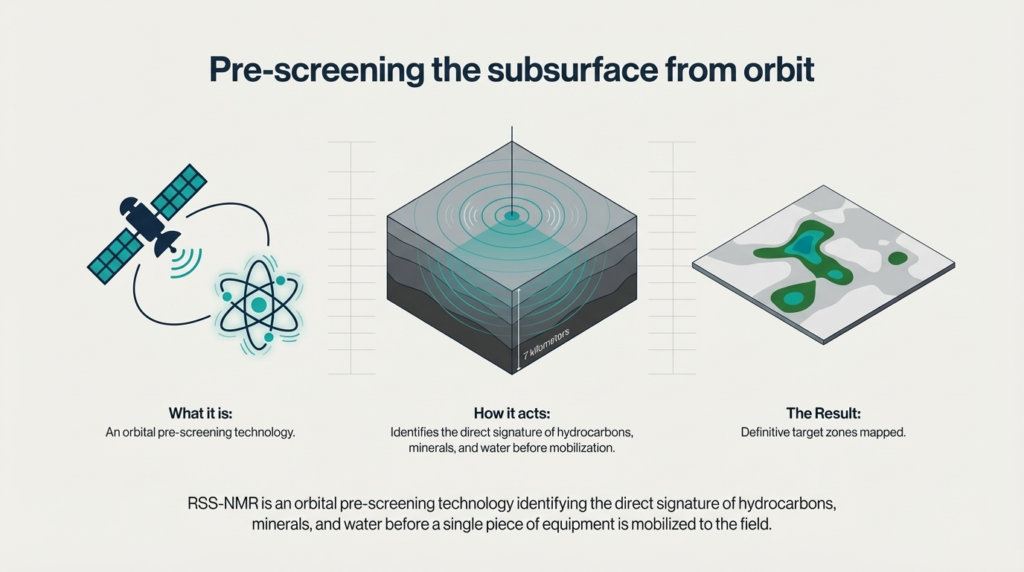
🔍Strategic role of RSS-NMR
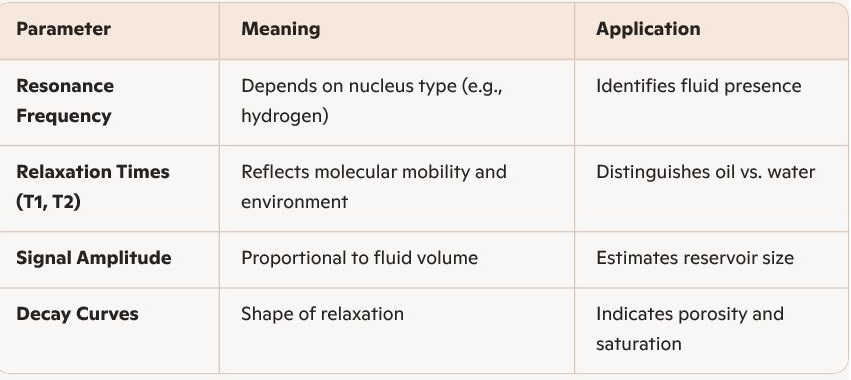
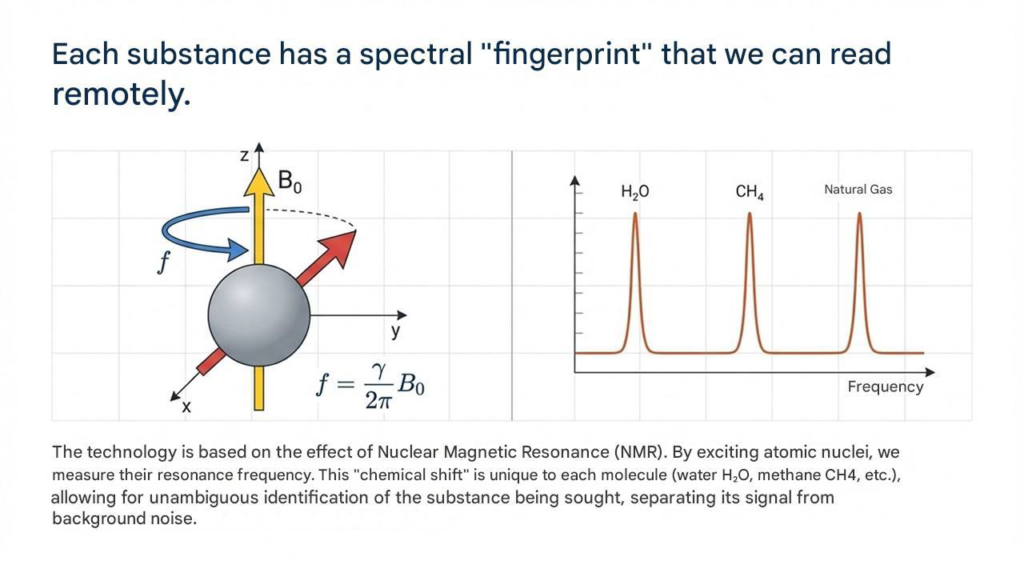
RSS‑NMR (Remote Sensing Surface Nuclear Magnetic Resonance) works by exploiting the magnetic properties of hydrogen nuclei in underground fluids, allowing direct detection of water, oil, or gas reservoirs without drilling. Its principle is based on exciting nuclear spins with a radiofrequency signal and measuring their relaxation response, which reveals the presence and type of subsurface fluids.
🔑 Core Principles of RSS‑NMR
- Nuclear Spin Resonance
- Certain nuclei (like hydrogen in water or hydrocarbons) have a magnetic moment due to their spin.
- When placed in a magnetic field and excited by a radiofrequency (RF) pulse, these spins resonate at a specific frequency.
- Excitation and Relaxation
- RSS‑NMR sends a controlled RF signal into the subsurface.
- Direct Fluid Detection
- Unlike seismic methods that infer structures indirectly, RSS‑NMR directly identifies fluids (water, oil, gas) by their magnetic resonance signature.
- This makes it highly reliable for distinguishing between hydrocarbon reservoirs and water-bearing formations.
- Depth Penetration
- The technique can probe up to 5–7 km below the surface, depending on the strength of the applied magnetic field and RF pulse design.
- This makes it highly reliable for distinguishing between hydrocarbon reservoirs and water-bearing formations
📊 Key Parameters Measured
⚙️ Advantages of RSS‑NMR Principles
- Direct hydrocarbon detection (no need for indirect geological inference).
- High precision (90–95%) in identifying fluid type.
- Non-invasive and eco-friendly, avoiding heavy seismic campaigns.
- Rapid results (weeks instead of months).
- The relaxation time (T1 and T2) provides information about the type of fluid and its environment.
⚠️ Limitations
- Signal strength decreases with depth, requiring strong equipment for deeper reservoirs.
- Lower availability compared to conventional seismic tools.
- Complementary role: RSS‑NMR is best used as a first step called ZERO STAGE, followed by seismic and drilling for confirmation.
👉 In essence, the principle of RSS‑NMR is to excite hydrogen nuclei in subsurface fluids with RF pulses and measure their relaxation signals, which directly reveals the presence, type, and quantity of hydrocarbons or water.
- Pre-screening before seismic surveys: It allows seismic efforts to be concentrated on the 20–30% of the area with the highest probability of success.
- Rapid evaluation of blocks under consideration: Companies can “see” the potential of a block before investing, providing a competitive advantage.
- Re-exploration of mature fields: Identify residual reserves and extend the life of existing fields.
- Complementarity: RSS-NMR does not completely replace seismic and drilling surveys, but it drastically reduces risks and optimizes planning.
- Validation required: Detected anomalies must be confirmed using conventional methods before development.
- Technological availability: Although promising, this technology remains less widespread than seismic surveys, which may limit its rapid adoption.
RSS-NMR VISION OF THE RESERVOIR
( POISK 1-9 softwares/2001-2017)
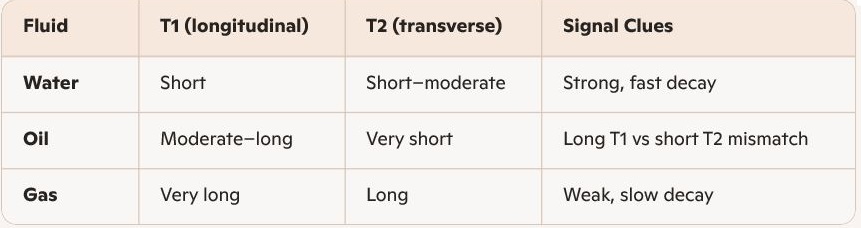
RSS‑NMR gets really interesting, because the relaxation times (T1 and T2) act like fingerprints for different fluids:
🧪 Relaxation Times in Practice
- 🔵 Water (free or bound)
- T1: Relatively short (milliseconds to seconds), depending on salinity and confinement.
- T2: Also short, but typically longer than hydrocarbons in porous media.
- Interpretation: Strong, fast-decaying signals → clear indicator of water saturation.
- 🟢 Oil (liquid hydrocarbons)
- T1: Longer than water, often in the range of seconds.
- T2: Much shorter than T1, because oil molecules are more viscous and restrict spin mobility.
- Interpretation: A mismatch between long T1 and short T2 is a classic oil signature.
- 🔴 Gas (hydrocarbons in gaseous phase)
- T1: Very long (tens of seconds), since spins are highly mobile.
- T2: Also relatively long compared to oil, but weaker in amplitude.
- Interpretation: Weak signals with long relaxation times → typical of gas reservoirs.
📊 Comparative Snapshot
🎯 Why This Matters
By analyzing T1/T2 ratios, geophysicists can differentiate oil from water even in mixed reservoirs.- Gas reservoirs stand out due to their long relaxation times and weak signals.
- This direct fluid typing is what makes RSS‑NMR so powerful compared to seismic, which only shows structures.
👉 So, in short: water relaxes quickly, oil shows a long–short mismatch, and gas relaxes very slowly. That’s how RSS‑NMR can tell them apart without drilling.
📉 Signal decay curve comparison (water vs oil vs gas)
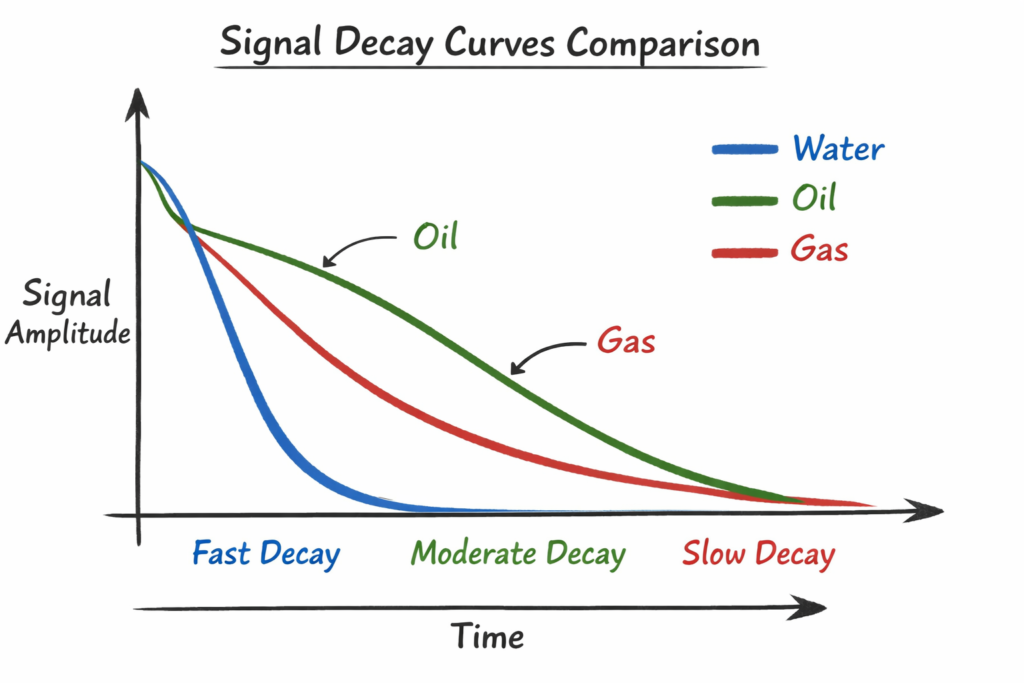
a comparative graph of signal decay* curves for water, oil, and gas.
*DEFINITION Decay (of organic matter) rot or decompose through the action of fungi or bacteria
- 🔵 Water : Starts strong and drops quickly → fast decay*.
- 🟢 Oil : Begins high but declines more moderately → moderate decay*.
- 🔴 Gas: Starts weaker and decays very slowly → slow decay*.
This visualization makes it clear how RSS‑NMR distinguishes fluids:
- water shows rapid relaxation,
- oil has a characteristic long–short mismatch,
- gas lingers with very long relaxation times.
geophysicists separate these signals quantitatively, not just visually That would be a great next step — a T1 vs T2 scatter plot gives a quantitative way to separate fluids based on their relaxation behavior.Here’s how it looks conceptually:
- 🔵 Water: points cluster toward short T1 and short T2, forming a tight group near the origin.
- 🟢 Oil: points spread along a diagonal where T1 is longer than T2, showing viscous behavior.
- 🔴 Gaspoints sit far out with very long T1 and T2, reflecting high molecular mobility.
This visualization helps geophysicists quickly classify reservoir fluids by plotting measured relaxation times from RSS‑NMR data.
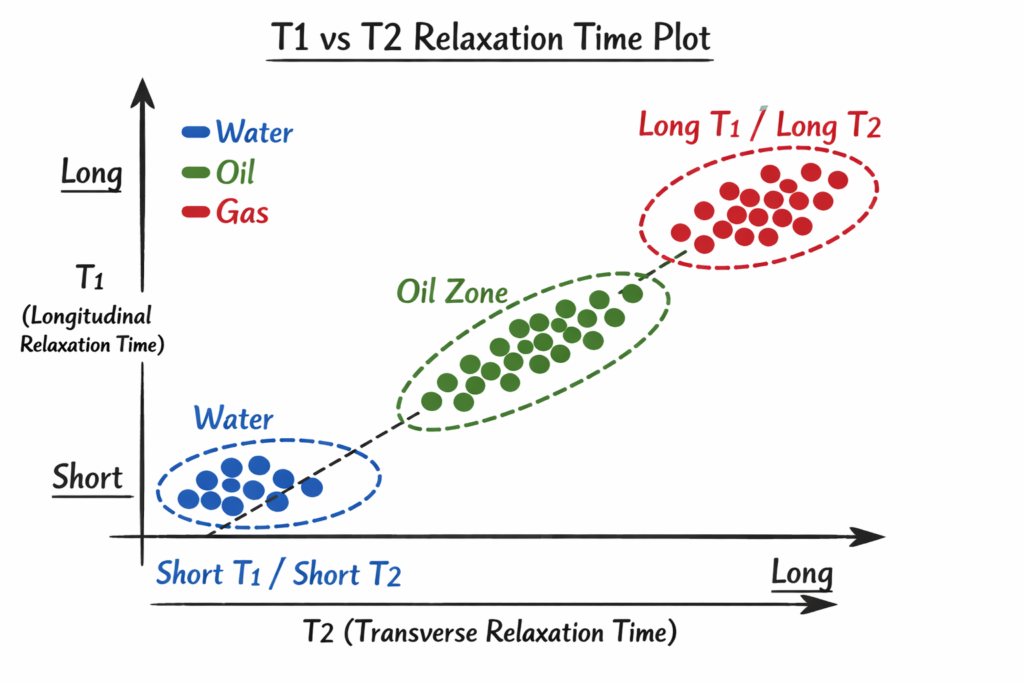
- 🔵 Water: → short T1 and T2, tightly grouped near the origin.
- 🟢 Oil: → long T1 but short T2, forming a diagonal “oil zone.”
- 🔴 Gas: → long T1 and long T2, far out in the upper‑right corner.
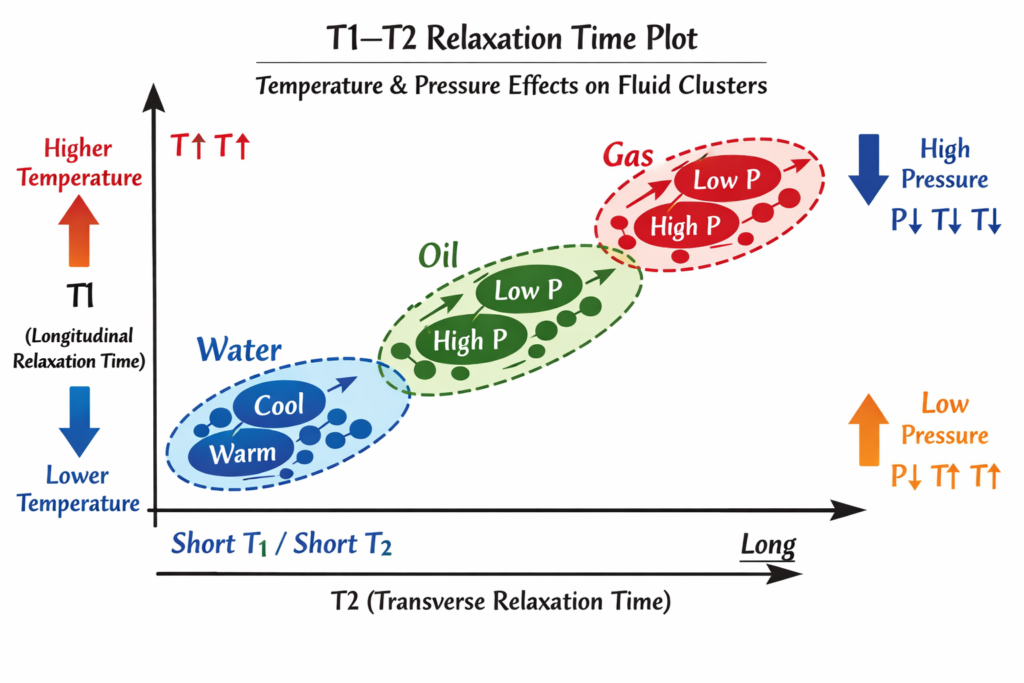
- This kind of plot helps geophysicists instantly identify fluid types from RSS‑NMR data. We can also show how temperature and pressure shifts affect these clusters in deep reservoirs
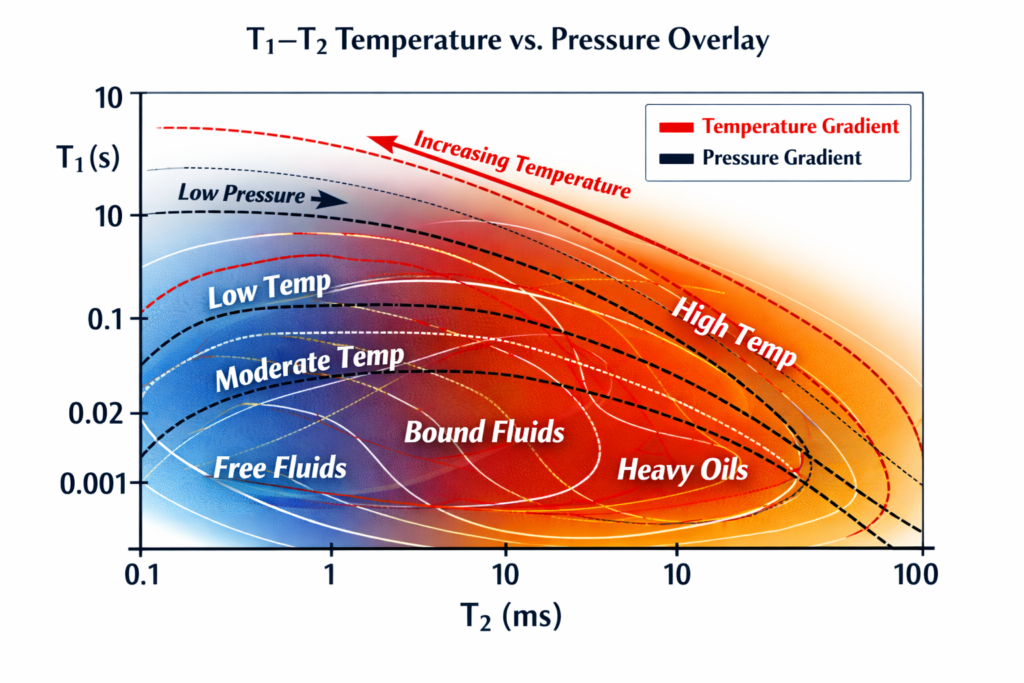
- Temperature and pressure shifts in deep reservoirs have a real impact on the T1–T2 clusters you just saw.
🌡️ Temperature Effects
- Higher temperature increases molecular motion, which lengthens both T1 and T2.
- Water clusters move slightly upward and right.
- Oil clusters stretch diagonally as viscosity decreases.
- Gas clusters expand further outward, showing even longer relaxation times.
- Lower temperature slows molecular motion, shortening T1 and T2, pulling all clusters closer to the origin.
⚙️ Pressure Effects
- High pressure compresses fluids, reducing mobility:
- Oil and gas clusters shift downward and left, showing shorter relaxation times.
- Water is less affected because its compressibility is low.
- Low pressure (near production zones or depleted reservoirs) allows more molecular freedom, lengthening relaxation times — clusters drift outward again.
📈 Combined Influence
In deep reservoirs (high pressure, moderate temperature):
A modified T1–T2 plot showing how temperature and pressure gradients reshape fluid clusters in deep reservoirs.
- Oil clusters often elongate diagonally, reflecting mixed viscosity zones.
- Gas clusters flatten, as pressure dampens their mobility.
- Water clusters remain compact but may shift slightly depending on salinity and confinement.
- In short, temperature stretches clusters outward, while pressure compresses them inward.
- Geophysicists use these shifts to infer reservoir depth, fluid phase transitions, and even production potential.
- 🔵 Water: Minimal shift; warmer conditions stretch the cluster outward slightly, while cooler ones compress it inward.
- 🟢 Oil: Strong sensitivity; high pressure pulls the cluster down and left (shorter relaxation), low pressure pushes it up and right (longer relaxation).
- 🔴 Gas: Most affected; under high pressure, the cluster contracts near the center, but at low pressure and high temperature it expands dramatically outward.
This dynamic view helps reservoir engineers interpret phase transitions and depth effects — for example, distinguishing between gas caps, oil zones, and water contacts in stratified formations
🧂 Salinity Influence
- Higher salinity increases ionic concentration, which enhances magnetic relaxation.
- Both T1 and T2 shorten, pulling clusters downward and left on the plot.
- Water clusters are most affected; oil and gas shift only slightly.
- Lower salinity (freshwater or low‑ionic brine) reduces relaxation efficiency.
- Clusters drift upward and right, showing longer relaxation times.
👉 In practice, salinity helps identify formation water vs. injected water or connate brine zones.
🧴 Viscosity Influence
📢High viscosity (heavy oil, tar sands) restricts molecular motion.
- T2 drops sharply, while T1 remains moderate, stretching the oil cluster diagonally.
- This creates a distinct “heavy oil zone” separate from lighter hydrocarbons.
- Low viscosity (light oil, condensates) allows freer spin movement.
- Both T1 and T2 increase, shifting clusters upward and right.
👉 Viscosity variations help distinguish light vs. heavy oil reservoirs and even detect thermal recovery effects.
📈 Combined Effect
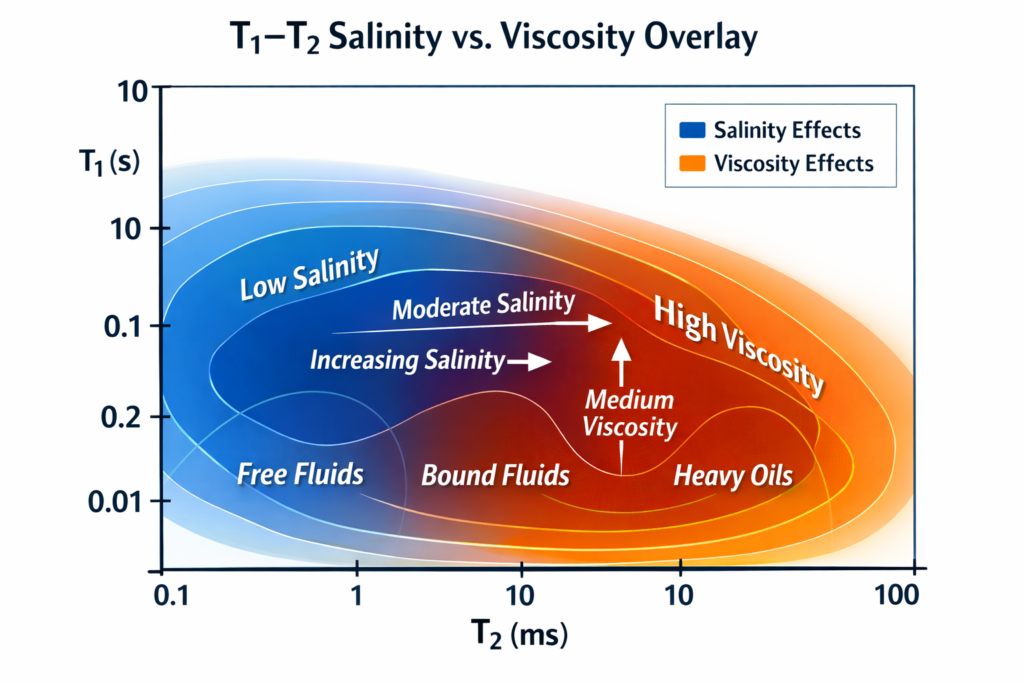
a T1–T2 plot showing combined salinity and viscosity effects on fluid clusters.
- 🔵 Salinity effects → As ionic concentration rises, water clusters contract inward (shorter T1/T2). Freshwater zones sit farther out, while saline formation water compresses toward the origin.
- 🟠 Viscosity effects → Heavy oils stretch diagonally downward (short T2, moderate T1), forming a distinct heavy‑oil zone. Light oils shift upward/right with longer relaxation times.
- 🟣 Overlap zones → Where saline water intersects viscous oil, clusters distort, signaling complex reservoirs or thermal recovery conditions.
This visualization helps distinguish connate brine vs. injected water, light vs. heavy hydrocarbons, and even track maturity gradients in reservoirs.
how salinity and viscosity jointly reshape fluid clusters.
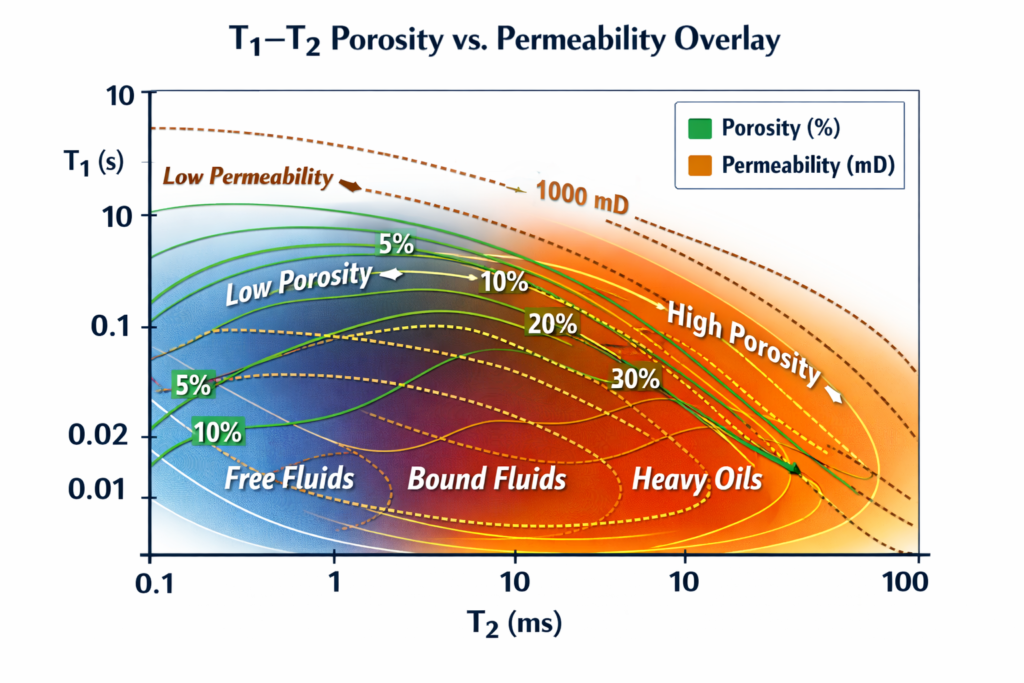
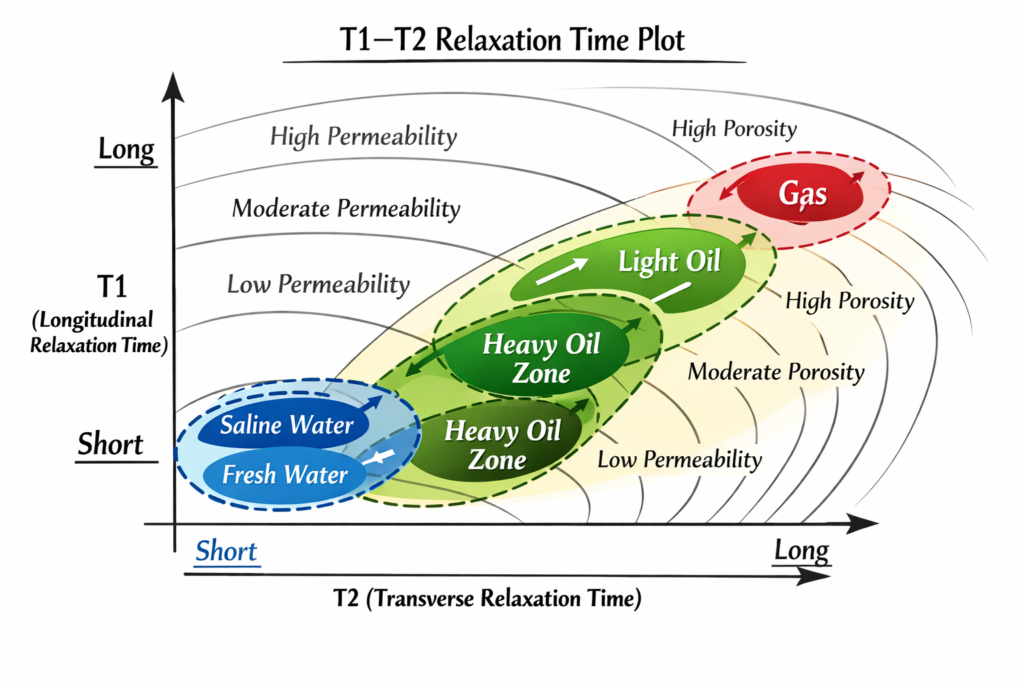
- 🟢 Porosity contours rise diagonally from low (bottom left) to high (top right). High‑porosity zones correspond to longer T1/T2, indicating open pore networks and mobile fluids.
- 🟤 Permeability contours slope oppositely, showing how flow capacity increases toward the lower right — where viscous fluids and connected pores coexist.
- 🔵 Free fluids occupy the high‑porosity, high‑permeability corner — productive zones.
- 🟣 Bound fluids sit in the overlap region — transitional, partially mobile.
- 🟠 Heavy oils cluster where permeability drops and viscosity dominates — low‑productivity zones.
This composite view helps reservoir engineers correlate NMR relaxation signatures with rock fabric and flow potential, bridging petrophysics and production forecasting
- 🔴 Temperature contours rise diagonally, stretching clusters outward as molecular motion increases. Gas and light oil zones expand toward longer relaxation times.
- ⚫ Pressure contours slope oppositely, compressing fluids and shortening T1/T2. Heavy oils and tight formations shift inward, reflecting reduced mobility.
- 🟣 Dynamic interplay: At moderate pressure and elevated temperature, clusters elongate — ideal for production. Extreme pressure flattens contours, signaling compaction and reduced permeability.
- 🟢 Interpretation: The intersection of high‑temperature and moderate‑pressure zones marks optimal reservoir conditions — balancing fluid mobility and rock integrity.
This overlay helps visualize thermal maturity, compaction trends, and phase behavior across depth.
RSS-NMR VISION OF THE RESERVOIR
(Poisk 10-16 /2017- 2…)
RSS‑NMR transverse relaxation time (T₂) plot
RSS‑NMR transverse relaxation time (T₂) plot — it captures how spin‑echo decay reveals fluid mobility and pore confinement.
- 🔵 Free fluids (long T₂) → slow decay, high mobility, typical of open pores or gas zones.
- 🟠 Capillary‑bound fluids (intermediate T₂) → moderate decay, partial confinement in pore throats.
- 🟢 Clay‑bound fluids (short T₂) → rapid decay, strong surface interactions, low mobility.
This single‑plot view is fundamental in reservoir characterization: the T₂ distribution directly maps pore‑size spectra and distinguishes producible fluids from immobile ones.
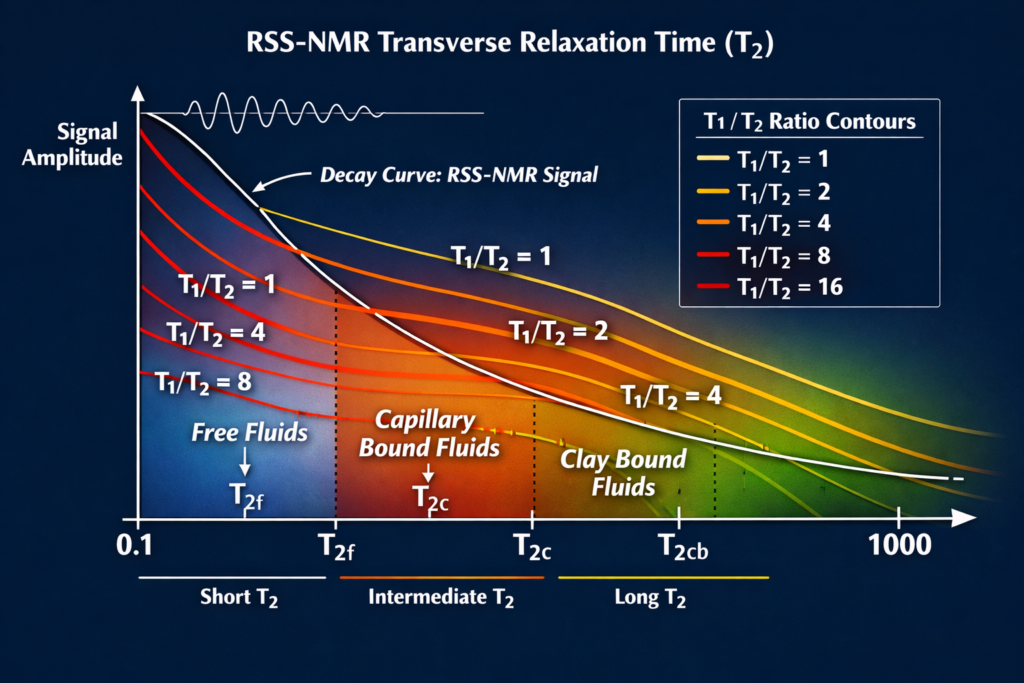
Here’s the T₁/T₂ ratio contour overlay — a refined visualization that highlights viscosity and wettability effects across fluid types.
- ⚪ T₁/T₂ ≈ 1 → Ideal for free fluids such as gas or light oil; spins relax uniformly, indicating minimal surface interaction.
- 🟡 T₁/T₂ ≈ 2–4 → Transitional fluids; moderate viscosity and partial wettability, typical of capillary‑bound zones.
- 🔴 T₁/T₂ ≥ 8–16 → Strongly surface‑dominated relaxation; heavy oils or clay‑bound water with high wettability and restricted mobility.
These contours sharpen fluid typing by linking molecular dynamics to surface affinity — a key step in distinguishing producible hydrocarbons from immobile water.
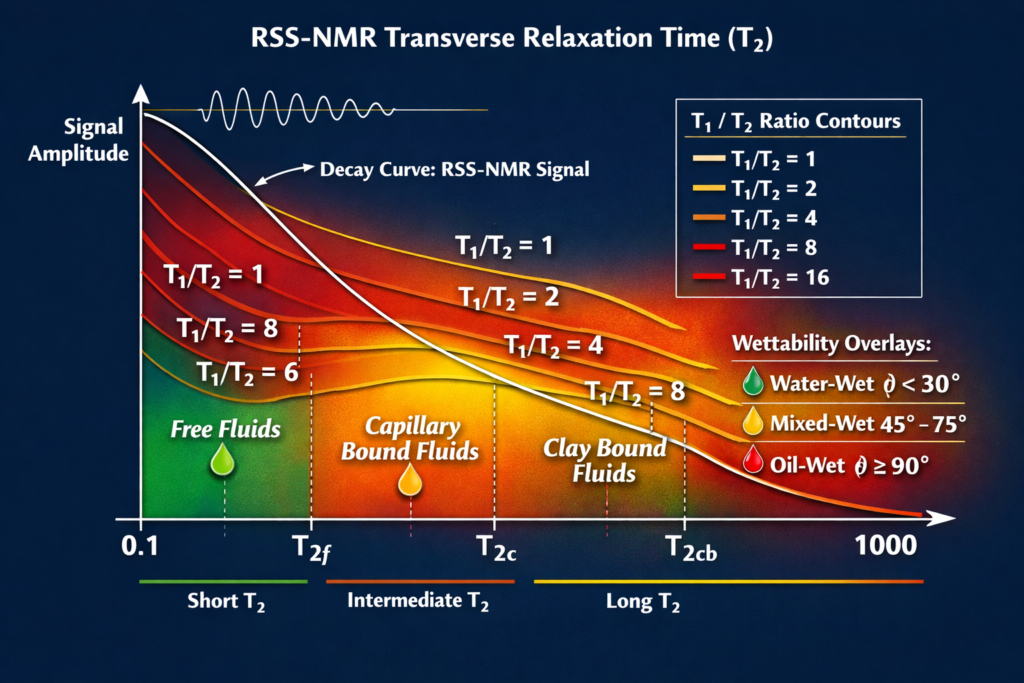
Here’s the extended visualization with wettability angle overlays applied to the T₁/T₂ ratio contours — now you can see how contact angle variations directly correlate with relaxation zones.
- 🟢 Water‑wet (θ < 30°) → Strong surface affinity, high T₁/T₂ ratios (≥ 8). Fluids are tightly bound to pore walls, typical of clay‑rich or hydrophilic reservoirs.
- 🟡 Mixed‑wet (45°–75°) → Transitional behavior, moderate T₁/T₂ ratios (≈ 2–4). Indicates partial oil‑wetting, common in heterogeneous sands.
- 🔴 Oil‑wet (θ ≥ 90°) → Minimal surface interaction, low T₁/T₂ ratios (≈ 1–2). Fluids relax freely, characteristic of hydrophobic pore systems.
This overlay bridges NMR relaxation physics with surface chemistry, making it possible to distinguish between hydrophilic vs. hydrophobic reservoirs and predict fluid recovery efficiency more precisely.
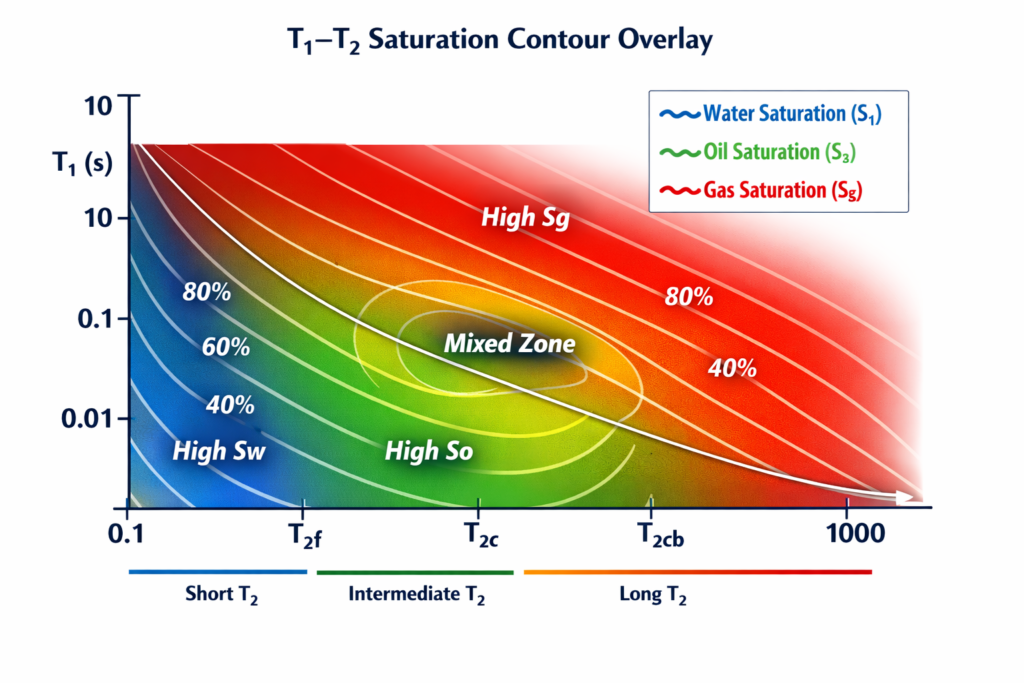
T₁–T₂ saturation contour overlay — a comprehensive layout showing how oil‑water‑gas ratios distribute across wettability zones:
- 🔵 Water saturation (Sᵥ) → clusters near the origin with short T₁/T₂, representing brine‑filled micropores and strong water‑wet conditions.
- 🟢 Oil saturation (Sₒ) → contours stretch diagonally upward/right, marking productive zones with moderate wettability and mobile hydrocarbons.
- 🔴 Gas saturation (Sg) → expands outward in the upper‑right corner, where long relaxation times indicate large, open pores filled with gas.
- 🟣 Mixed zone → overlapping contours reveal multiphase coexistence — critical for identifying transition regions and displacement fronts.
This layout bridges fluid type, wettability, and saturation, enabling direct interpretation of reservoir phase distribution and productivity potential.
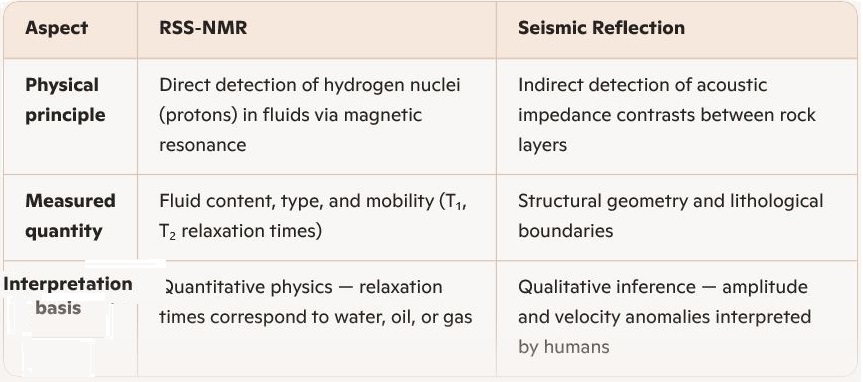
Why RSS‑NMR (Remote Sensing Surface Nuclear Magnetic Resonance) is revolutionizing reservoir evaluation compared to traditional human interpretation of seismic reflection data.
⚙️ Fundamental Difference in What’s Measured
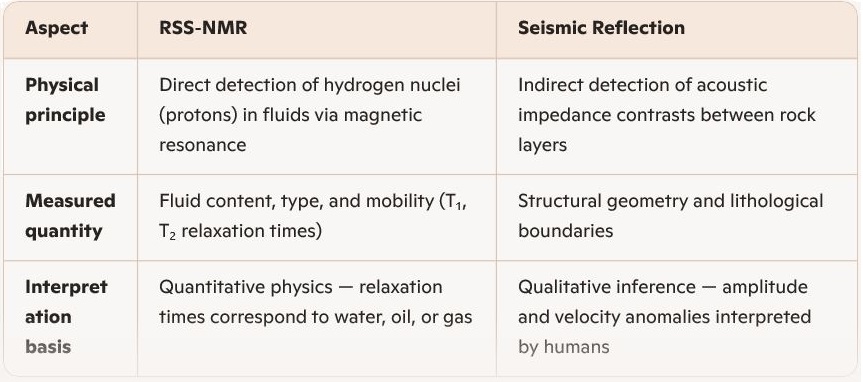
🧠 Why RSS‑NMR Interpretation Is More Reliable
- Direct fluid identification
RSS‑NMR measures the magnetic response of fluids themselves, not just the rock structure. It distinguishes oil, gas, and water by their relaxation signatures — something seismic cannot do without drilling confirmation. - Reduced human bias
Seismic interpretation depends heavily on the geophysicist’s experience and assumptions about velocity models, lithology, and migration artifacts. RSS‑NMR data are processed algorithmically, minimizing subjective bias. - Quantitative reservoir capacity
RSS‑NMR provides volumetric estimates of hydrocarbon saturation and porosity directly from relaxation distributions. Seismic reflection only infers potential traps — capacity must be estimated later through indirect modeling. - Environmental and operational efficiency
RSS‑NMR can be deployed remotely with minimal field disturbance, while seismic campaigns require extensive logistics and post‑processing. - Integration advantage
When combined with seismic, RSS‑NMR validates which anomalies actually contain hydrocarbons — turning speculative “bright spots” into confirmed reservoirs
🎯 In short
RSS‑NMR gives physics‑based, fluid‑specific, quantitative data, whereas seismic reflection gives geometry‑based, interpretive, qualitative data.
That’s why reservoir capacity interpretation is more accurate, faster, and less subjective with RSS‑NMR than with human seismic analysis alone.
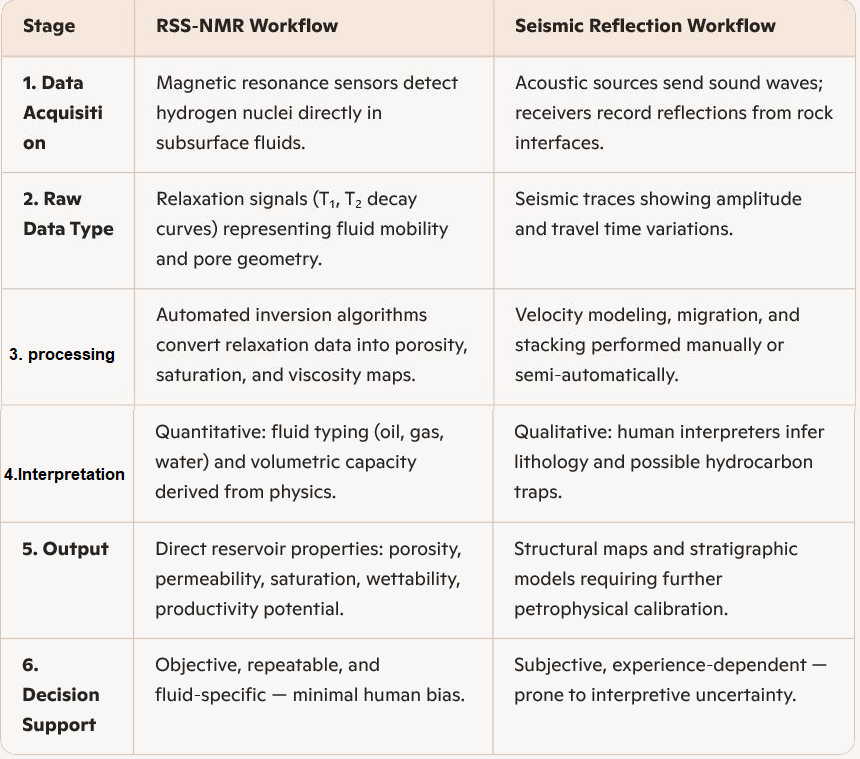
Would you like me to show a side‑by‑side workflow diagram comparing how data move from acquisition to reservoir capacity estimation in both methods?
🧩 Workflow Comparison
🚨In summary:
RSS-NMR is used as a first step because it reduces costs, accelerates decision-making, and minimizes risks, while providing a reliable image of reservoirs before making significant investments in seismic and drilling surveys.
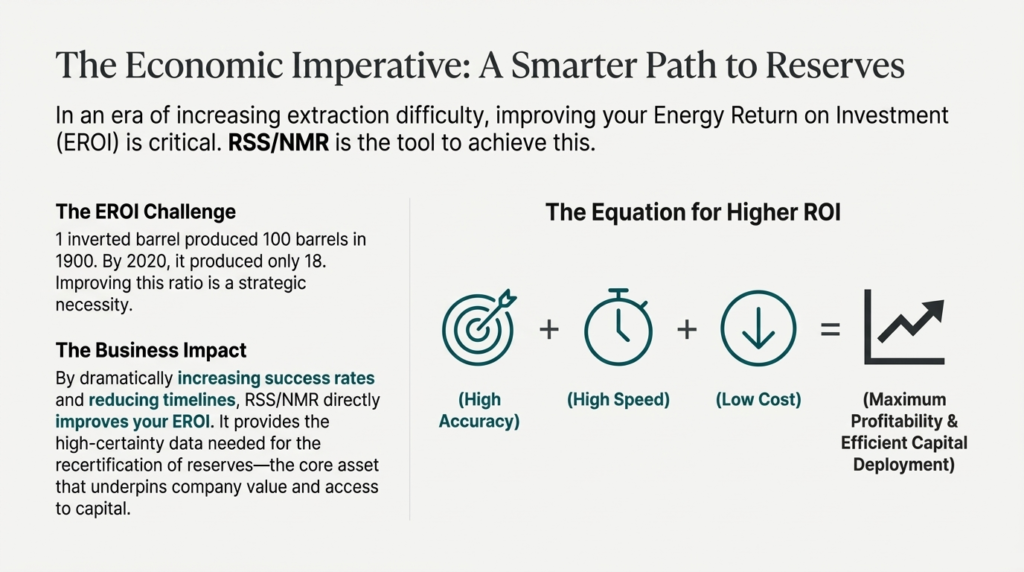
Increased accuracy can be achieved down to seven kilometers, onshore or offshore. This technique minimizes the environmental impact on the surface because there are no field operations. Ultimately, tarjeted exploration is the inevitable evolution to maximize the profitability and efficiency of new or existing assets.
🧠 Key Insight
RSS‑NMR bypasses the indirect inference chain of seismic interpretation. Instead of guessing fluid presence from acoustic contrasts, it measures the fluids themselves, yielding a physics‑based reservoir capacity rather than a human‑interpreted structural hypothesis.
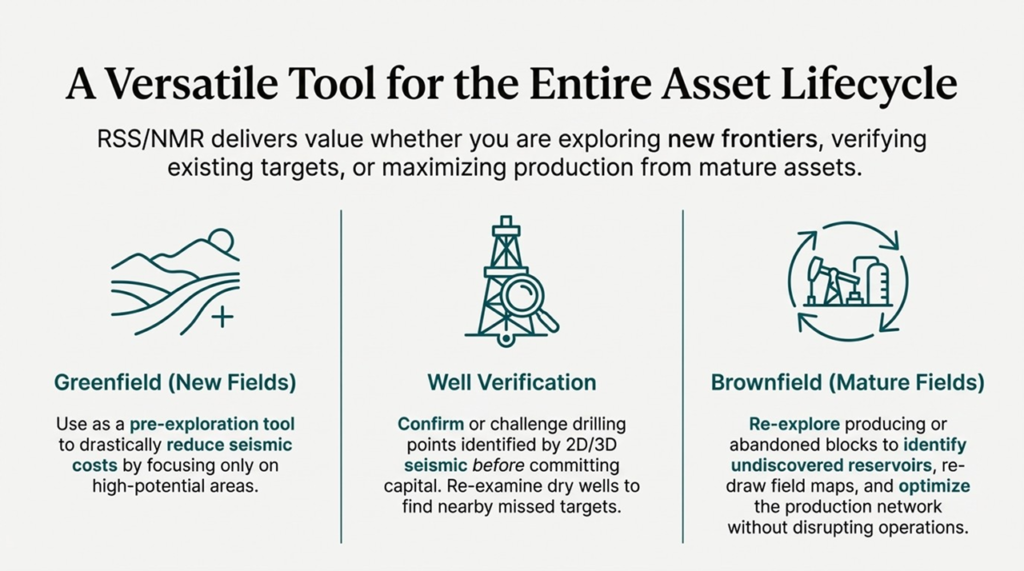
A-Greenfields
🔍Very low cost for a complete analysis of a large area very quickly, without the need for heavy on-site deployment.
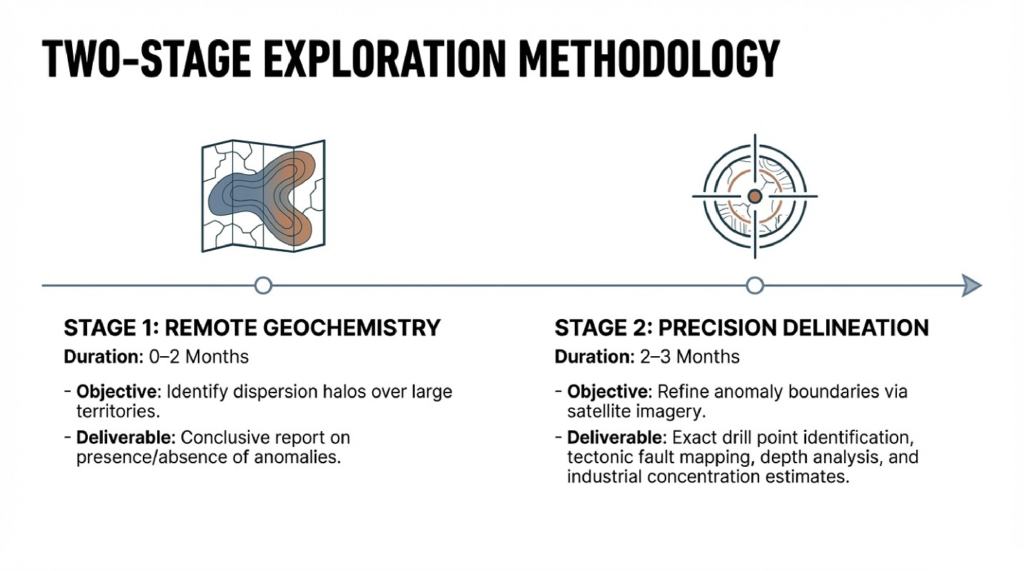
🔍 This preliminary analysis takes only 4 to 6 months and reduces the area to be explored to the sweet spots (zones where the RSS-NMR has confirmed the presence of the product being sought, such as gas, condensate, oil, water, metal, diamond etc.).
🔍Since all these operations are carried out without human intervention on the ground, there is no environmental impact or speculation on the site (discreet or spy-like operation).
🔍No NGO protests, No backshish, No investment in a Permit to Explore
B-Brownfields
🔍Old oil fields can be re-explored to identify reservoirs that were not detected or were incorrectly detected during previous seismic surveys, all while production continues simultaneously, thus avoiding any production interruption.
🔍 Another advantage is the ability to continue operating the same block without having to redo all the administrative documentation, as this is a modification of the production plan and not a new project.
🚨KEY POINT : In case of negociations for buy an Asset, the RSS-NMR gives you an idea of the actual potential of the reservoirs in production but , and more important, if some hidden reservoirs are present on this oilfied
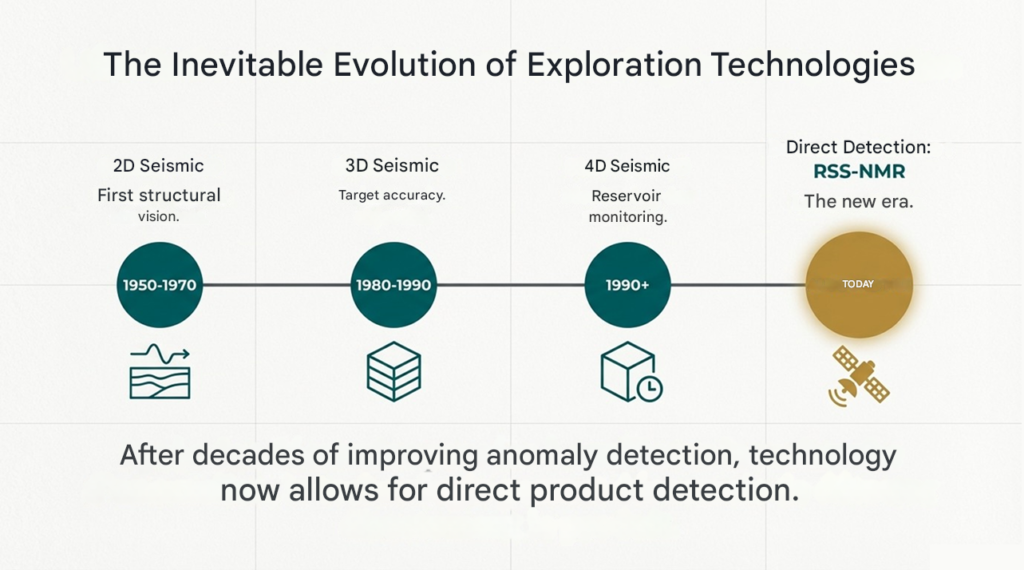
1. The Inevitable Evolution: From Blind Exploration to Surgical Precision.
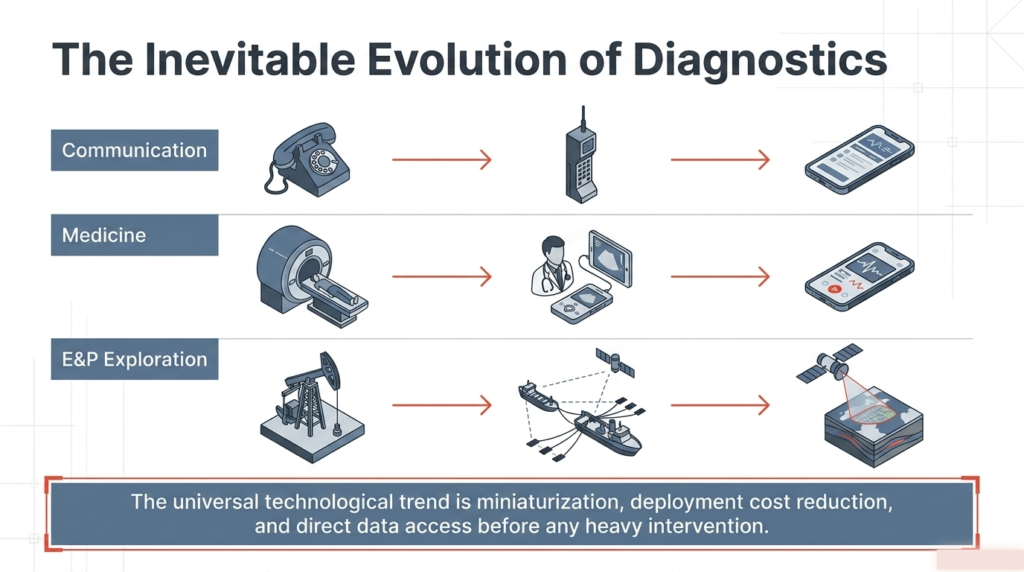
👉 The exploration and production (E&P) industry is now subject to a universal law: the inevitable evolution of diagnostic techniques.
👉Like telecommunications and medicine before it, E&P must abandon its massive and invasive methods in favor of miniaturization and direct data access.
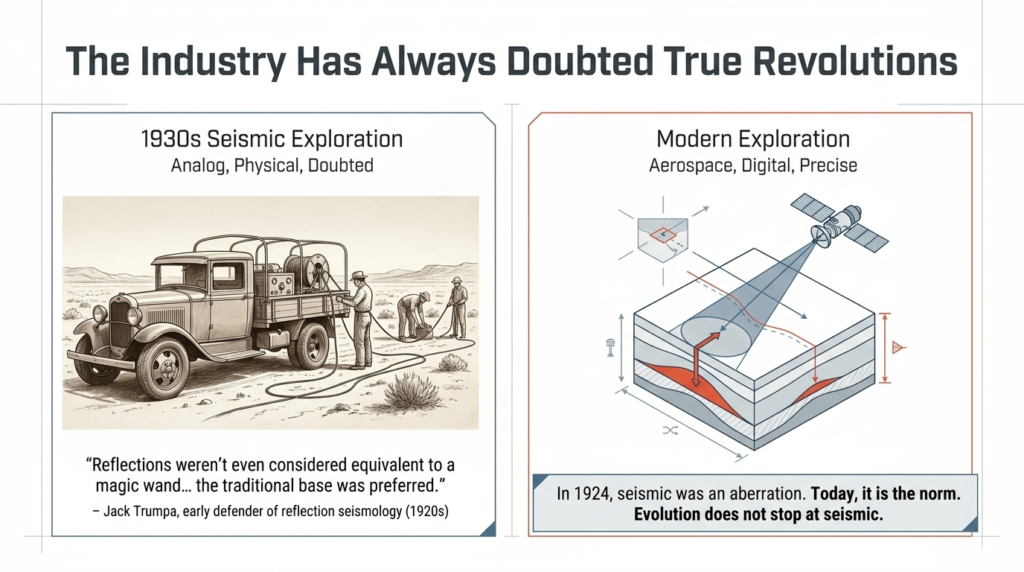
‼️Yesterday, we relied on a global, “blind” seismic survey; today, we are moving to direct and focused detection.‼️

👉he scale of precision is also changing, and the collection of parameters allows us to proceed all the way to well construction engineering.
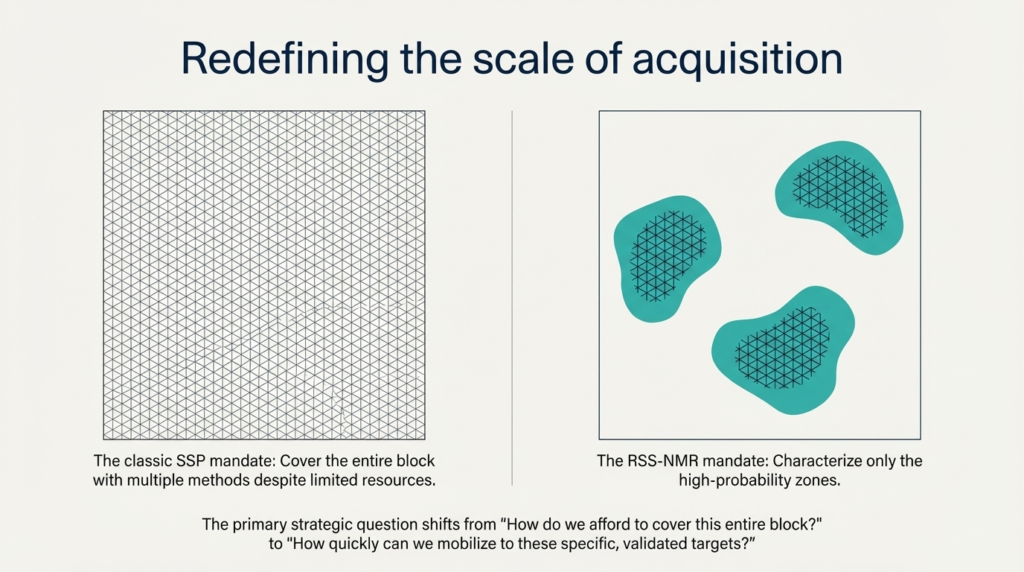
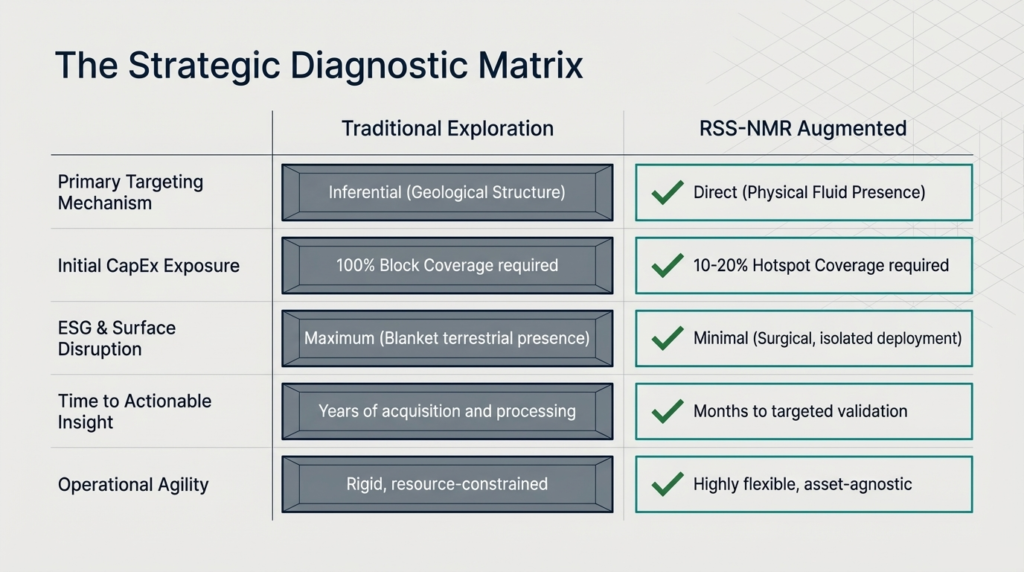
👉Every exploration and production (E&P) company must transition from systematic exploration (100% block or reservoir coverage) to sweet point exploration, using Direct Satellite Detection (RSS-NMR) to delineate areas of interest to be explored with one or more test wells.
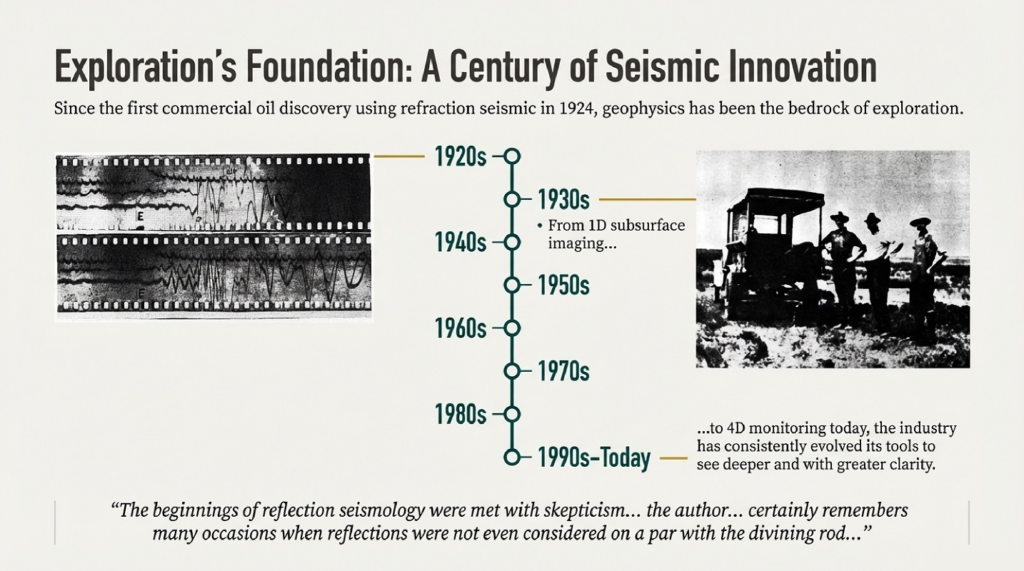
👉This transition marks the end of blind exploration. In 1924, seismic surveying was considered an “aberration,” except by pioneers like Jack Trump, before becoming the norm. Today, the evolution doesn’t stop at seismic surveying; it transcends it with aerospace-grade precision. To understand this shift, it is essential to analyze the financial and operational burden of an obsolete model, and we are speaking specifically about systematic exploration.
2. The Burden of the Status Quo: Why the “100% Seismic” Model is Losing Steam Due to its Prohibitive Costs
2A- This RSS-NMR filtering must be done before starting any operations, you must do it before to start the “Kafkaesque Labyrinth of Local Bureaucracy”.
📋 obtain an oil exploration permit (onshore or offshore), a company must generally fulfill several specific administrative requirements, which vary from country to country but are fairly similar in their overall structure.
📌Observation: Performing RSS-NMR exploration without requesting a legal exploration permit allows us to reach the same decision point but without paying taxes or fees.📌
6-A-Direct Costs for a “Permit of Exploration”
STANDARD SEISMIC
🔎Solution: Performing RSS-NMR exploration without requesting an exploration permit allows us to reach the same decision point but without paying a lot of taxes or fees.
⁉️Why spend significant sums of money to obtain a legal exploration permit when an RSS-NMR or Stage Zero exploration allows us ( in Spy mode) to see if the block has real potential? For E&P, once this Stage Zero exploration is completed, there’s a simple answer:
✅YES for the exploration permit because there are interesting sweet spots.
⛔️NO, it’s a largely barren block, and we’re not going to waste our time and money.
A standard seismic survey could prove a real nightmare for the PIC, particularly in terms of logistics if the block is large. After the RSS-NMR survey, conducted with or without an exploration permit, the situation becomes simpler because if the block is of interest, it means that all points of interest have been identified.
🛑NO SWEET POINT : not necessary to report nothing to authorities ( if using the spy mode) and you pass to an other RSS-NMR project, thedecision is simple.
✅SWEET POINTS AVAILABLE : Considering superficie in % and the potential of the sweet points in the asset , the E&P can start the implementation of the permit of exploration. Its a managment decision!
📌I). General Legal Framework for an 100% legal
📋In most countries, oil exploration is governed by a mining/hydrocarbons law and a petroleum code that establish the conditions for granting, monitoring, and renewing permits (PERs, licenses, blocks, etc.).
📋One example vermilionenergy. The permits for exploration are generally granted by a central authority (Ministry of Mines & Hydrocarbons, Petroleum Authority, or equivalent) and can be onshore (onshore) or offshore (at sea).
📌II). Main Administrative Obligations
📋Here are the typical obligations before obtaining and during the operation of an exploration permit:
- Legal Structure and Technical/Financial Capabilities
- The company must be legally constituted (oil operator status, commercial company, etc.).
- It must demonstrate sufficient financial capacity (bank guarantees, share capital, project history) and technical capacity (team, subcontractors, exploration experience).
- Content of Permit Application (onshore or offshore)
- Submission of an application for an exclusive exploration permit (PER) or a prospecting license, including a description of the block, objectives, timeline, and prospecting methods (seismic, drilling, etc.).
- Presentation of economic commitments (minimum work program, investment schedule, drilling or data obligations).
- Environmental and Social Impact Assessments (ESIA)
- Completion of an Environmental and Social Impact Assessment (ESIA) adapted to the onshore or offshore context, including ecological risks, pollution risks, waste management, oil and gas, etc.
- Public consultation, compliance with national and sometimes international environmental standards. rcneee
- Additional and regulatory authorizations
- Obtaining environmental, industrial safety, and risk management permits (spill response plan, safety plan, etc.)
- Compliance with safety, flag state (offshore), strategic storage, and technical standards (coastal, platforms, vessels, etc.) regulations.
- Tax and Contractual Compliance
- Signing of a petroleum contract or agreement (production sharing, royalties, corporate tax, etc.) according to the country’s regulations.
- Compliance with tax, reporting, and transparency obligations (declarations, payments, advance or progressive royalties).
🔑3-Procedures and Approximate Duration
📋The total time required to obtain an exploration permit depends on the country, the type of area (onshore/offshore), and the complexity of the studies, but some recurring patterns are observed:
3.1-Procedure Duration (Review and Granting)
⏳Under several regimes, the administrative review of an exclusive exploration permit (PER) can take from a few months to 1 to 2 years, depending on the workload of the administration and the complexity of the projects.
🔍For complex offshore projects, the public consultation, the Environmental Impact Assessment (EIA), and contract negotiation can extend the duration to 18 to 36 months.
3.2-Initial Duration of the Exploration Permit
🔍In France and some other countries, the PER is granted for a maximum duration of approximately 5 years, with the possibility of extension (often 1 or 2 renewals) subject to compliance with work obligations.
🔍In other offshore jurisdictions (e.g., Australia, Anglo-Saxon context), exploration permits are often issued for 2 to 6 years, renewable under conditions (abandonment of a fraction of a block, positive results, etc.).
📑4. Exemple synthétique (onshore vs offshore)
| Élément | Onshore (typical) | Offshore (typical) |
| Permit type | “PER (exclusive exploration permit) | “Petroleum exploration permit / offshore license |
| Initial duration | Approximately 5 years, renewable | “5 to 6 years, often renewable |
| Approximate review time | 6 to 24 months | 18 to 36 months (more complex) |
| Main studies | Simplified or full EIA, field, routes, social impact | Offshore EIA, marine risks, spill, vessels, fauna |
📑5-Practical Note
🔍As legislation varies considerably from one country to another (France, African countries, Canada, etc.), it is essential to consult the local mining or hydrocarbons code and specific texts (decrees, regulations, guidelines from the Petroleum Authority).
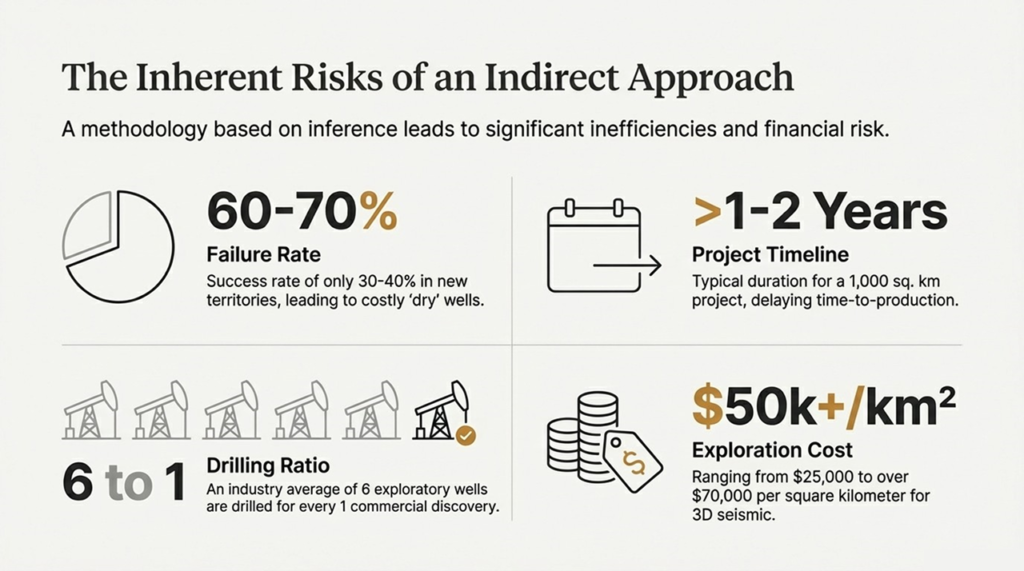
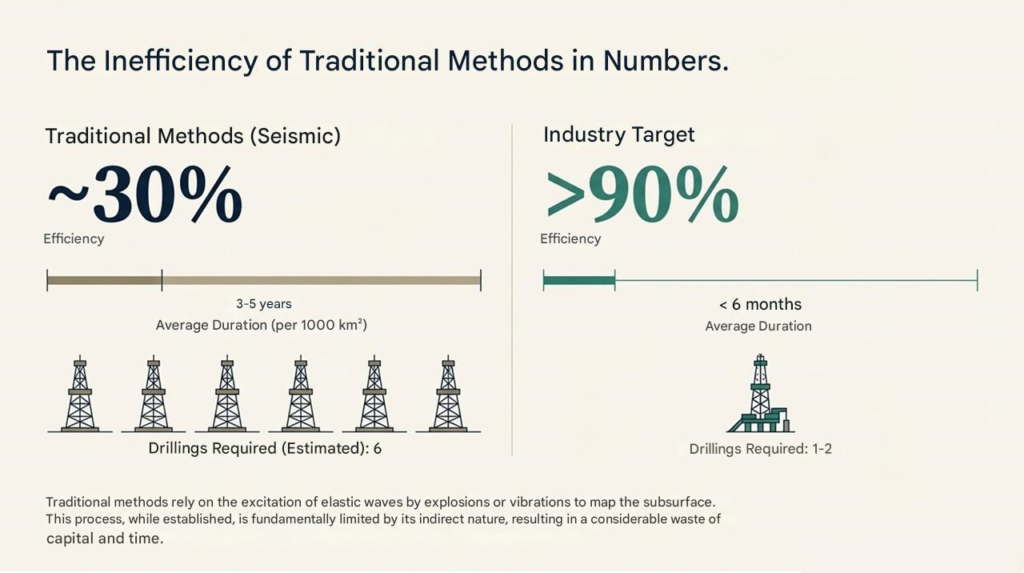
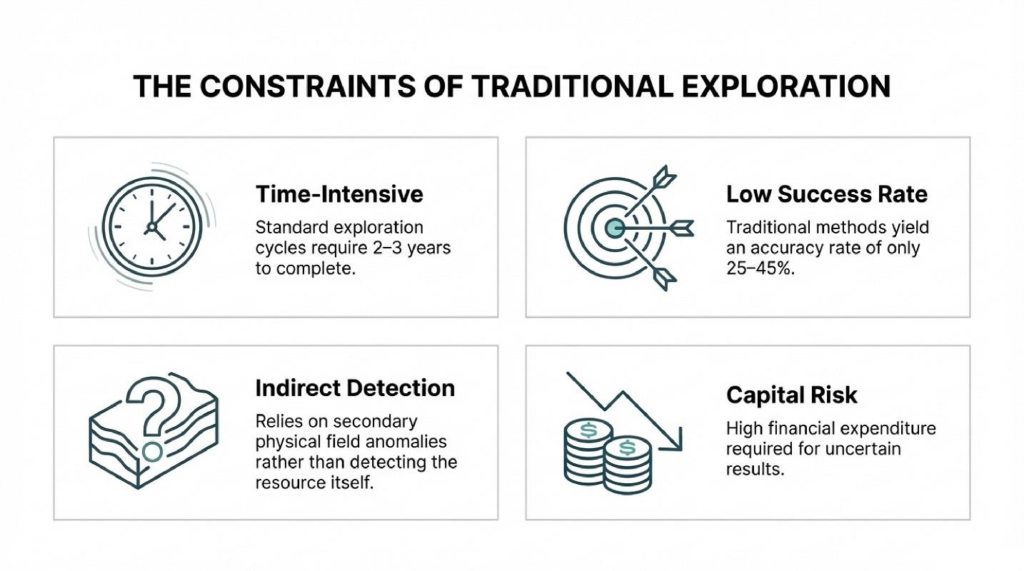
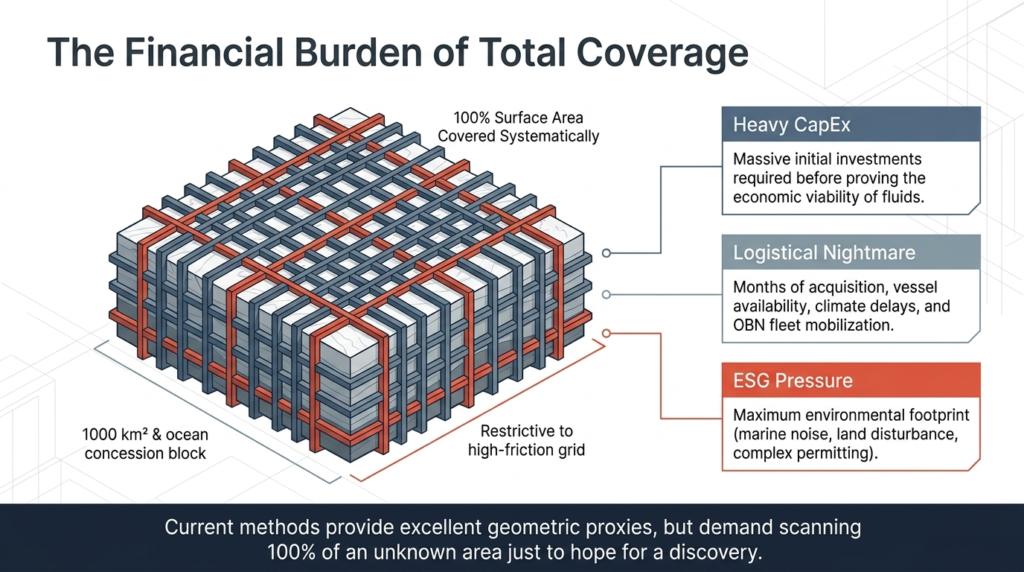
🔍Maintaining the traditional model imposes an unsustainable burden—the “Financial Burden of Total Coverage.” For a typical 1,000 km² concession, current systematic methods require scanning the entire area in the statistical hope of finding fluids. This model generates three critical dead ends:
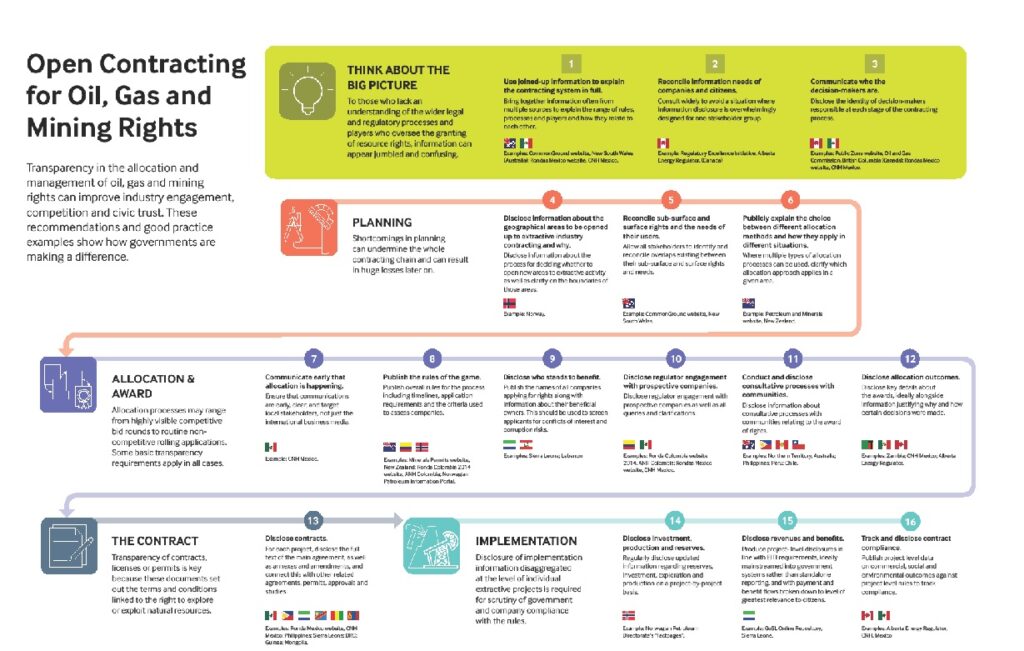
Source https://www.opengovpartnership.org/fr/stories/opening-up-extractives-contracting-to-deter-corruption-what-weve-learned/
6-The E&P Expert’s Insight or Anosognosia of the E&P
💸The costs associated with obtaining an offshore exploration permit include both administrative and compliance fees paid to the state or regulatory authority, and technical and operational costs related to preparing the application and initial work. We speak of salary in the E&P or the cost of sub contractation of specialized companies)
✔️I-Non-Recoverable Award Bonus
💵When an offshore permit is awarded, the state or national oil company may require an award bonus (often in the millions of dollars per block, depending on the area). This bonus is generally paid upon signing the oil contract and is not recoverable as part of production costs.
✔️II-Application and Permit/License Fees
💵Application fees (registration, processing fees, annual royalties) are charged by the oil authority or regulatory agency (e.g., Canadian offshore authority, African oil authorities).These fees can range from a few hundred thousand to several million dollars over the permit’s duration, depending on the block size and jurisdiction.
💵Macro Study for the permit:Preliminary geological and geophysical analyses, market studies, profitability modeling, done by the uncionaries of the E&P have a cost internal but must be incorpored in the costs of the project
💵Environmental and Social Impact Assessments (EIA/EIA Offshore): Studies of marine biodiversity, oil spill modeling, socio-economic impact studies.Their cost can range from tens to several hundred thousand dollars, especially if they involve offshore scientific campaigns.
💵Legal, Tax, and Contractual Advice: Negotiation of production sharing contracts/offshore licenses, tax optimization, operator structuring. Fees for lawyers and consultants specializing in the oil industry can amount to several hundred thousand dollars.
✔️III-Others indirect Costs
💵Incentivates for be sure that the documentation for the permit is going on and well. all administration in third world countries have an indirect cost
💵Sharing: In case thet the project is huge he must be shared with others Privates E&P and its an indirect cost.
💵Fees for lawyers and consultants specializing in the oil industry can amount to several hundred thousand dollars.
💵NGO compensations: they have also an indirect cost for a“No formal” approval but very important because they can move a lot of thing against the private E&P
✔️IV-Regulatory and Compliance Costs -Regulatory and Oversight Fees
💵 Regulatory and oversight fees: In some countries, the onshore and offshore authority charges operators for regulatory costs (inspections, audits, training, technical oversight). These fees are often based on actual costs and can increase significantly with the complexity of the project (ultra-deepwater, sensitive deposits).
💵 Insurance and Guarantees: Requirement to take out environmental liability insurance, pollution risk insurance, well liability insurance, etc. Premiums and bank guarantees can range from tens of thousands to millions of dollars, depending on the area and the size of the block.
🎯 7-Minimum Work Program if the permit for a seismic is granted
📋Work in field or in the bloc : Marine surveys, 2D/3D seismic or OBN offshore and Stryde onshore, and then onshore or offshore drilling, which are often mandated by the authority during the first few years of the permit. For example, the cost of an offshore well can range from tens of millions to over $100 million per deep well, depending on the depth and complexity.
📋Permit Maintenance Costs
Periodic royalties, contributions to the oil fund, renewal payments if the exploration permit is extended,
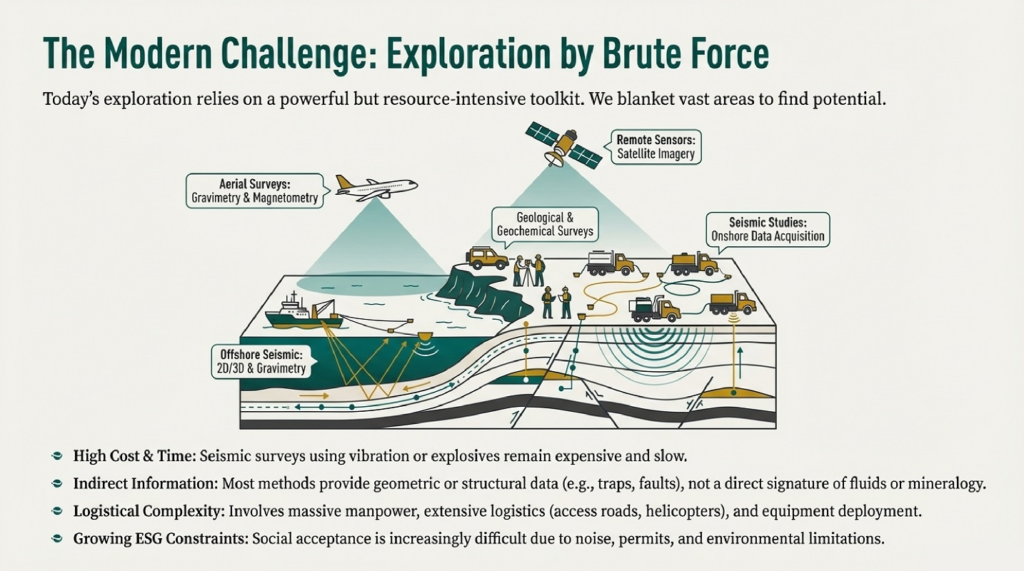
🌧️ Logistics Nightmare: Data acquisition takes months, mobilizing enormous marine fleets of 3D and OBN vessels, or thousands of land-based nodes (Explosion or Stryde). This deployment is hampered by global bottlenecks (ship availability) and operational windows limited by climate and tides. surestaries or change of plan have an huge cost if you change or increase or stop your seismic project
| Technology | Rôle Stratégic | Principal Objective | Operational Footprint | Duration in months |
|---|---|---|---|---|
| RSS-NMR | “Le Filtre Radar Global” | Pre-selection and Identification of Fluids. | None (Zero impact, 100% remote). | 5-8 months |
| Magnéto Tellurism (MT) | The costly “Deep Support” | Deep Calibration and Resistivity. | Weak (Lightweight teams). | 12-18 months |
| Traditional Seismic 3D/ OBN / Stryde | “The Detailed Magnifying Glass” | High-resolution 3D mapping. | Maximale compared to the RSS-NMR (Noise, heavy logistics). | 24 to 60 months |
🌧️ Extreme ESG Pressure : The environmental footprint is at its maximum (marine acoustic noise, prolonged terrestrial disturbances), making obtaining regulatory permits increasingly uncertain. The Government or the country can stop the project or claiming for Extra Costs
🌧️ Strong NGO Ingerence: NGO are always present for claiming “complementaries compensations”
Resume
| Cost Type | Approximate Order of Magnitude (Offshore) |
| Permit Award Bonus | From a few million to several tens of millions of dollars per block |
| Application Fees / Royalties | From a few hundred thousand to several million dollars over time |
| Offshore Technical Studies | From several hundred thousand dollars to a few millions dollars |
| Legal Fees / Consulting / Scientific Studies and EIA | From a few hundred thousand to several million dollars |
| First Offshore Drilling ( apprasial well) | 20 to 100+ million dollars per well depending on depth |
8-L’Insight of the project manager/PIC (Person In Charge):
♟️The PIC faces an “impossible optimization problem”: the obligation to cover 100% of an unknown geographical area while attempting to minimize the systemic risk of drilling a dry well. For the E&P its like to play a sort of Texas Hold’em no Limit Poker on this particular project.
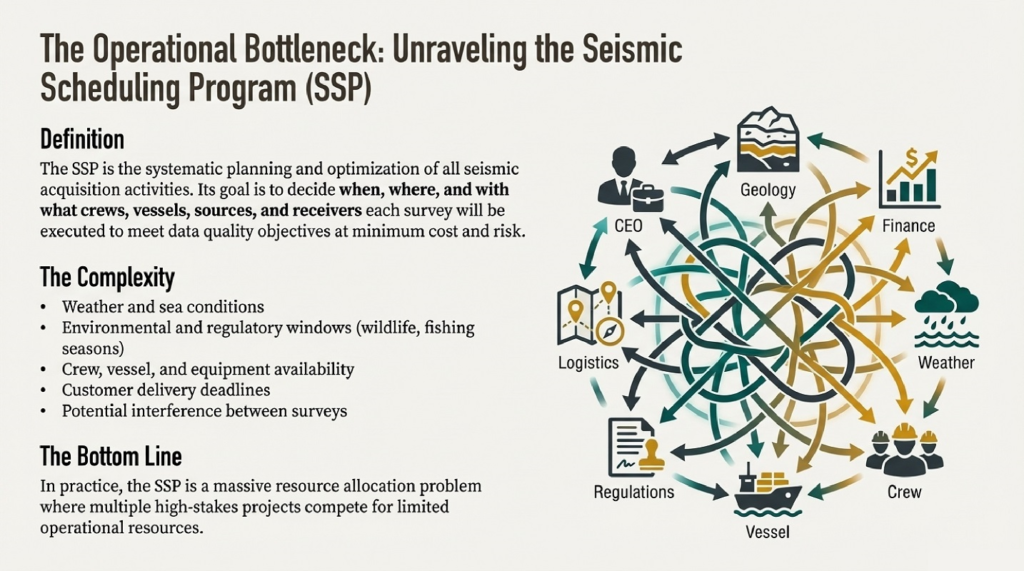
♟️For avoid this type of situation , the RSS-NMR technology solves this equation by substituting the geometry of rocks with fluid resonance. the Texas Hold’em no Limit Poker becomes a simple Klondike solitary !
💰Massive CapEx and Immobilized Capital: Multimillion-dollar investments are executed blindly. The result is “locked-up capital” or “trapped capital” for years before economic viability is even proven through the presence of the desired cash flows.
💬9-Standard seismic over 100% of the permit is really Mandatory ?
Why invest such large sums in a comprehensive feasibility study and seismic activities on a potentially barren well?
- Why dedicate so much of the E&P budget to exploration, which is sometimes unnecessary?
- How many employees need to be assigned to this type of project over such a long period?
- Why not diversify projects instead of focusing on a single project that could lead to a dead end?
- Can political risk be reduced by diversifying the preliminary projects studied by RSS-NMR?
- If so, can the company leverage different geographic areas?
- In the event of a conflict with NGOs, why tarnish the reputation of the E&P sector with environmental groups, which have considerable influence on governments, and with the general public?
- The media likes to exploit the E&P sector to divert attention from more serious problems. These are classic arguments used by governments.
- Why announce to shareholders that the company has lost so much money on a single project?
- Can the repercussions of an unsuccessful exploration project affect stock prices?
- Could governments concerned about consistent oil production question the capacity of exploration and production companies for the next P/E cycle?
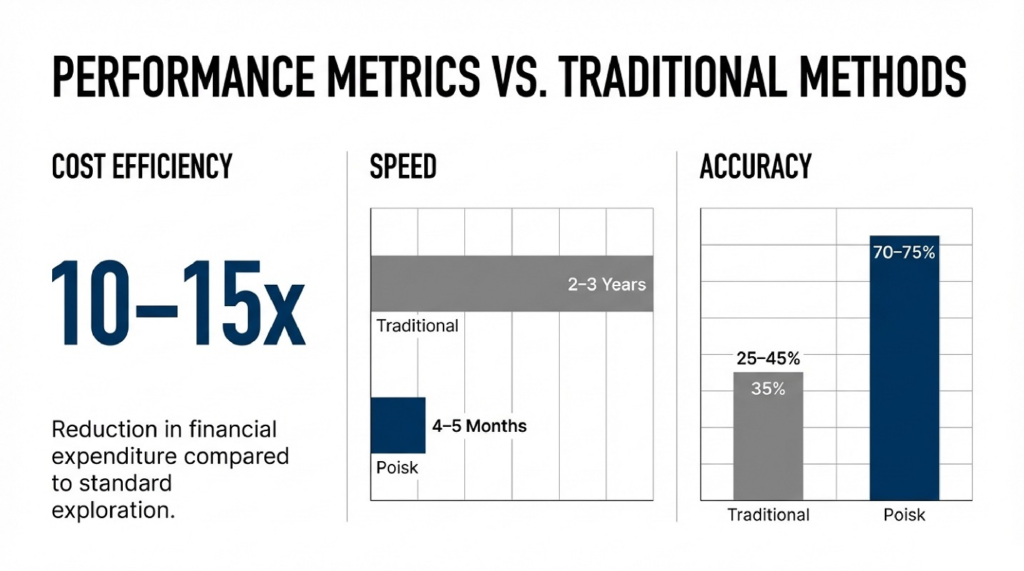
💹10. RSS-NMR vs. Traditional Seismic: Measuring Fluids Rather Than Rock
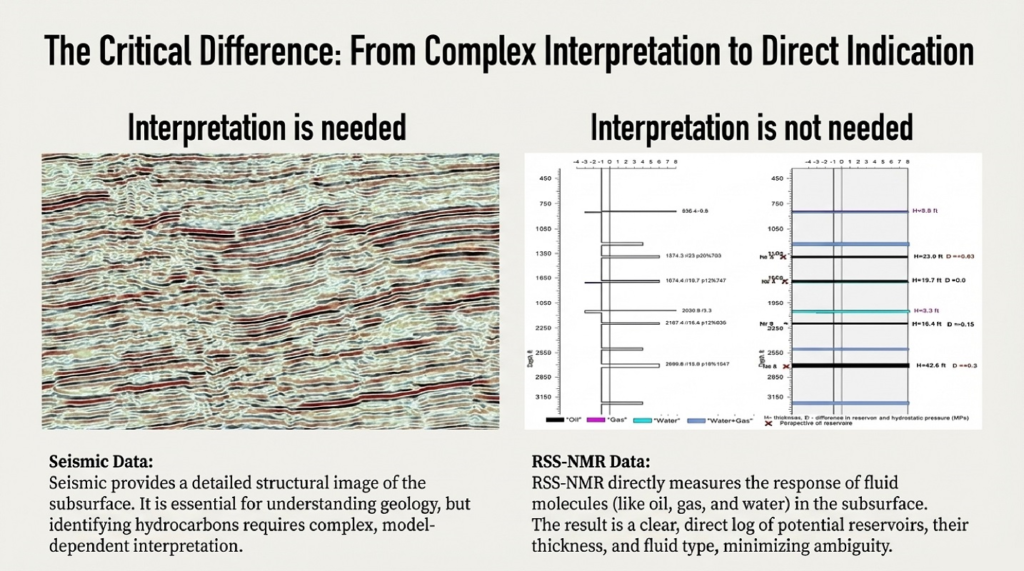
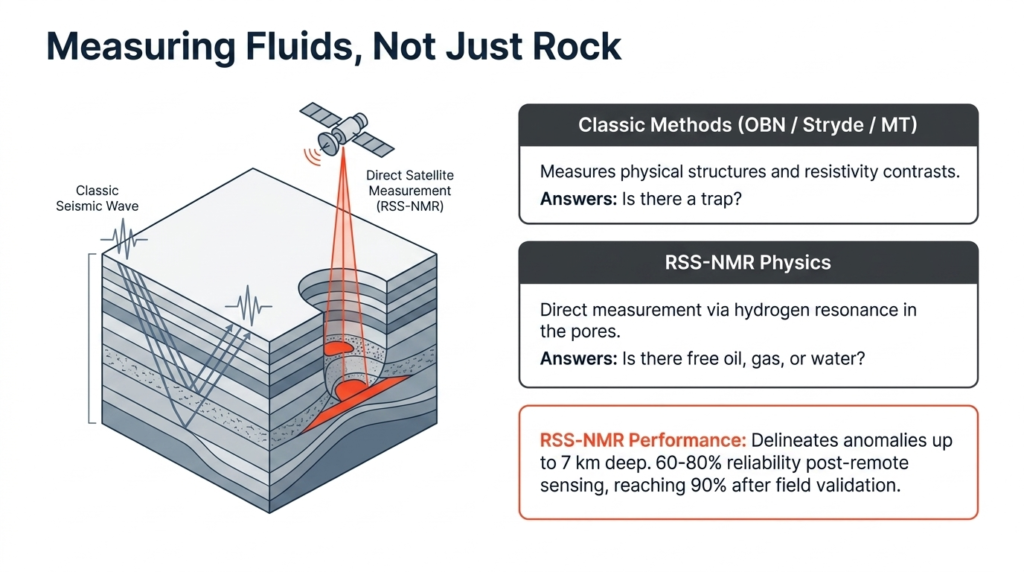
❓The technological breakthrough lies in applied physics. Where seismic surveys (OBN/Stryde) and magnetotelluria (MT) search for geometric proxies and structural traps, RSS-NMR directly targets the molecular signature of the product being sought. In fact, with traditional seismic surveys, the question arises: “Is there a structural trap, an anomaly that will take two years to interpret?” And in this case, we have the human factor, because if we’re talking about interpretation, it’s often human and subjective. The resulting errors can be very costly.
❓However, with Step Zero, that is, by performing a search using RSS-NMR, the answer is direct using the sole inquirie : “Is there oil, gas, or free water?” It’s YES or NO.
❗The Expert’s Insight: We move from “Complex Interpretation” (deciphering confusing seismic waves to guess the presence of fluid) to “Calibrated Direct Reading.” RSS-NMR doesn’t guess structures; it characterizes deposits by directly reading hydrostatic pressure and exact depths via a precise bar chart (Gas, Oil, Water).
| Caracteristics | traditional seismic Tools (2D / 3D / OBN / Stryde / MT) | RSS-NMR (by Satellite) |
|---|---|---|
| Target to be measured | Structures physiques et contrastes de résistivité. | Hydrogen resonance in pores |
| Central question | “Is there a structural hatch?” | “Is there oil, gas,metal, gems or free water?” |
| Depth | Variable, often limited by resolution. | Delineates anomalies up to 7 km deep onshore or offshore. |
| Reliability | 30-50% (based on human interpretation). | 75-80% detection; 95% after validation. |
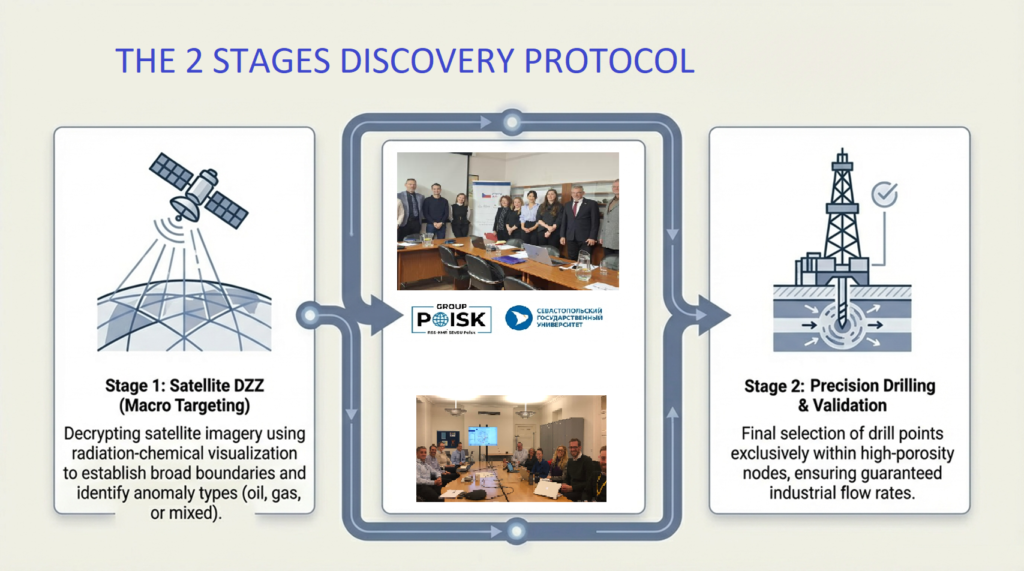
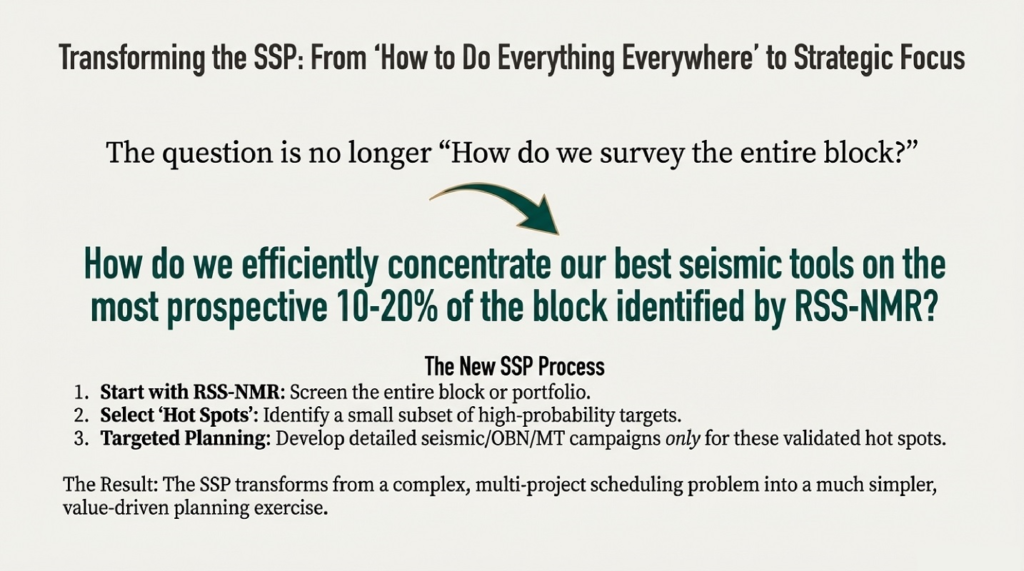
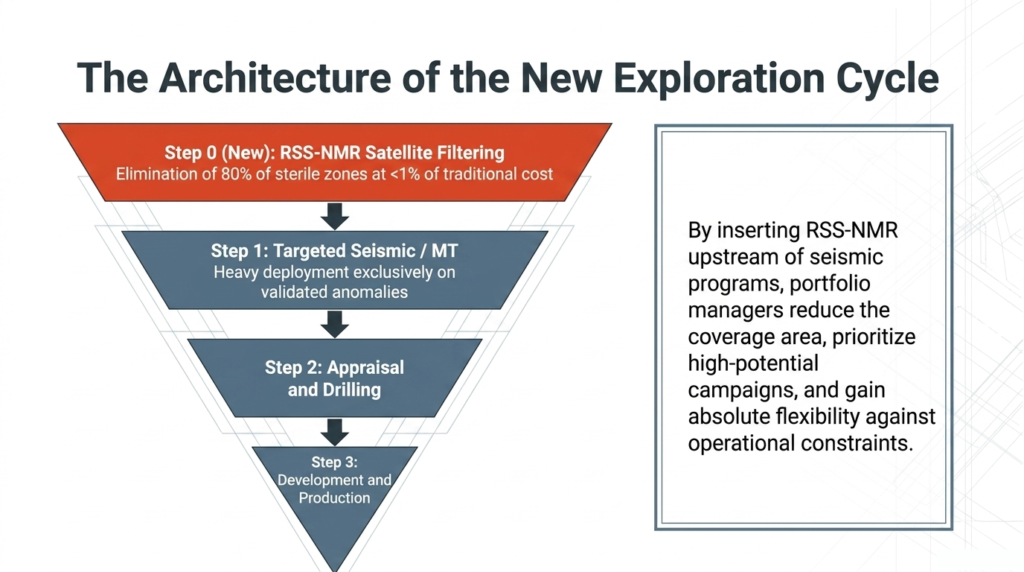
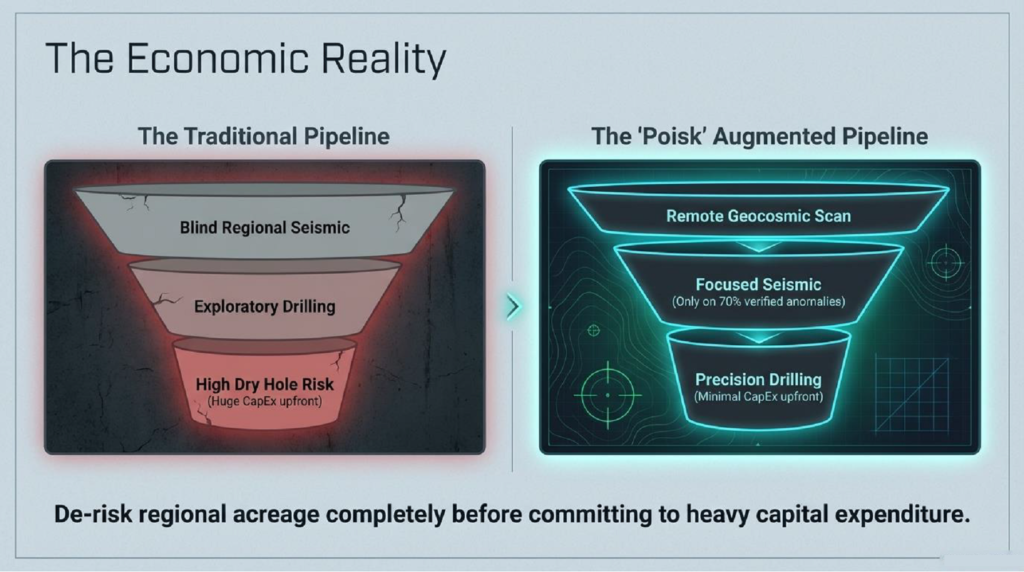
▶️ 11. The Architecture of the New Exploration Cycle: The “Stage 0″is considered as a the “Mandatory Strategic Filter”
📋The integration of RSS-NMR redefines the exploration hierarchy by inserting an upstream filter that protects capital investment in this exploration project.
✅RSS-NMR should be the first step in exploring a new oil field because it allows for the direct detection of hydrocarbons down to a depth of 7 km, with 90–95% accuracy, at a significantly lower cost than conventional seismic surveys and with minimal environmental impact.
📡 Why start with RSS-NMR?
- Direct fluid detection: Unlike seismic methods that require complex interpretation, NMR-SSR sends a hydrocarbon-specific signal and captures its re-emission, providing direct evidence of the presence of oil or gas.
- Exploration depth: It can explore down to 5–7 km below the surface, covering deep reservoirs without initial drilling.
- Speed: Results are available in 90 days to 5 months, accelerating decision-making on which blocks to explore.
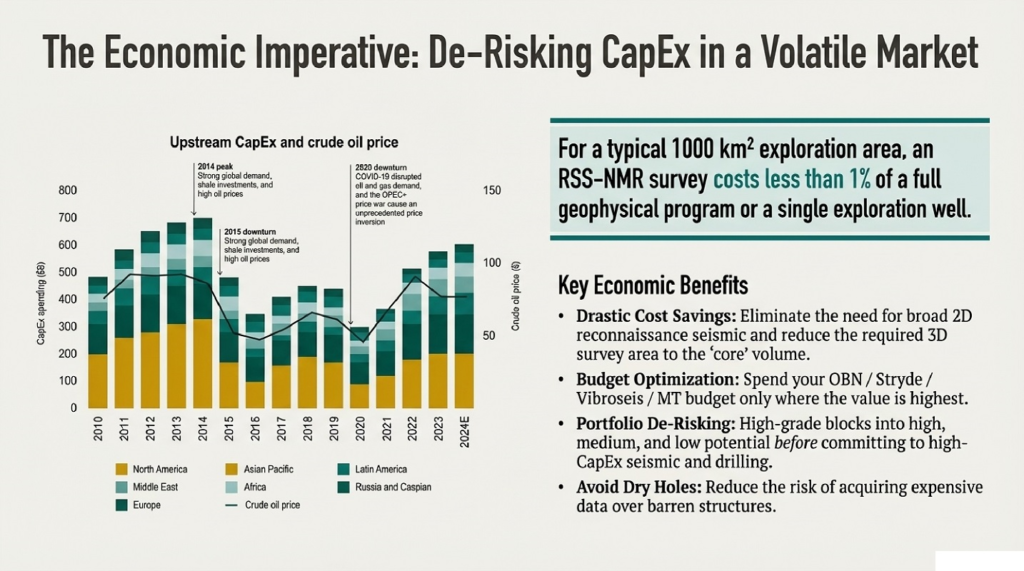
- Cost reduction: The cost per km² is up to 15 times lower than that of conventional seismic surveys, saving tens of millions of USD by avoiding dry drilling.
- Reduced environmental impact: No need for extensive field campaigns or ecological disturbances, which is crucial in sensitive areas.
🎯 Strategic role of RSS-NMR
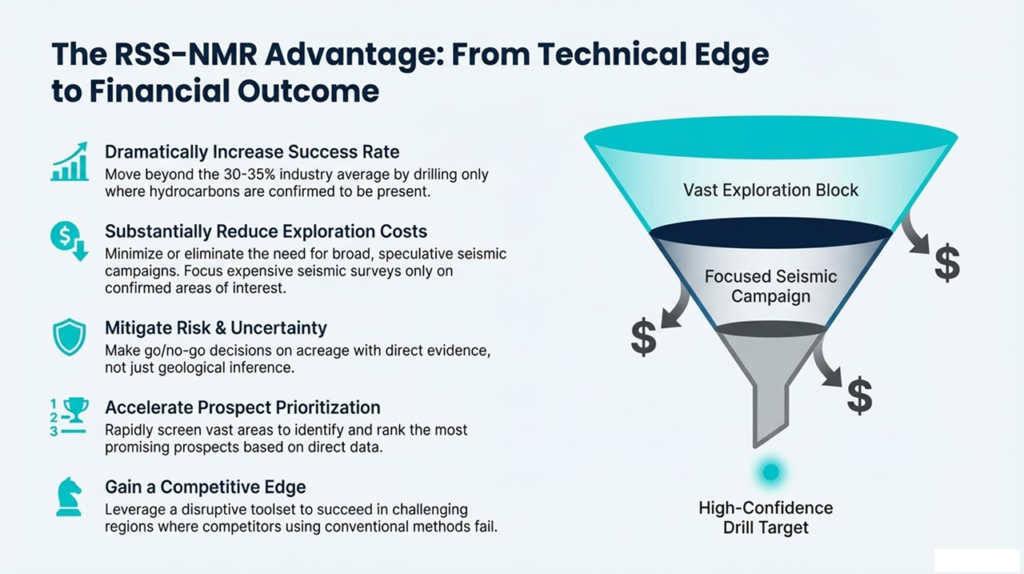
- Pre-screening before seismic surveys: It allows seismic efforts to be concentrated on the 20–30% of the area with the highest probability of success.
- Rapid evaluation of blocks under consideration: Companies can “see” the potential of a block before investing, providing a competitive advantage.
- Re-exploration of mature fields: Identify residual reserves and extend the life of existing fields.
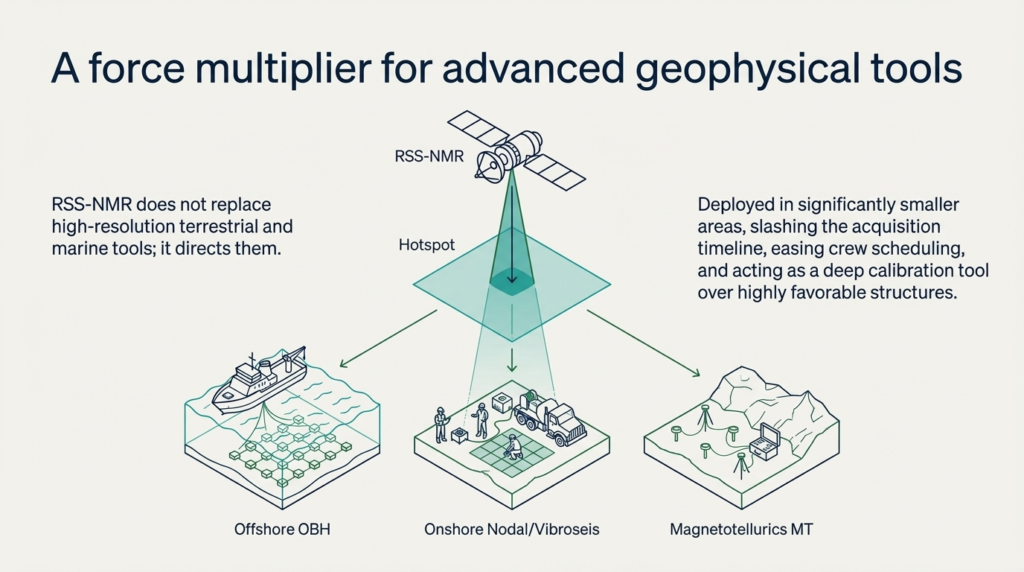
- Complementarity: RSS-NMR does not completely replace seismic and drilling surveys, but it drastically reduces risks and optimizes planning.
- Validation required: Detected anomalies must be confirmed using conventional methods before development.
- Technological availability: Although promising, this technology remains less widespread than seismic surveys, which may limit its rapid adoption.
👉 In summary: RSS-NMR is used as a first step because it reduces costs, accelerates decision-making, and minimizes risks, while providing a reliable image of reservoirs before making significant investments in seismic and drilling surveys. Would you like me to also explain how companies combine RSS-NMR and 3D seismic surveys to maximize the profitability of a field?
12.This RSS-NMR filter becomes the “Mandatory Barrier” which allows the project to move forward and start field operations after obtaining a full exploration permit.
Step 0 (New) – RSS-NMR Satellite Filtering: Elimination of 80% of sterile areas for less than 1% of the total budget. “Sweet Spots” are immediately identified. This step takes 4 to 6 months to provide a clear answer: YES or NO, the product being sought is present.
💻At this point, an initial decision-making session takes place based on the RSS-NMR results. The PIC has the important answers that condition the continuation of the exploration so that top management can make the final decision and initiate the seismic permit process. The key elements that emerge from the RSS-NMR and that will allow top management to give the green light are:
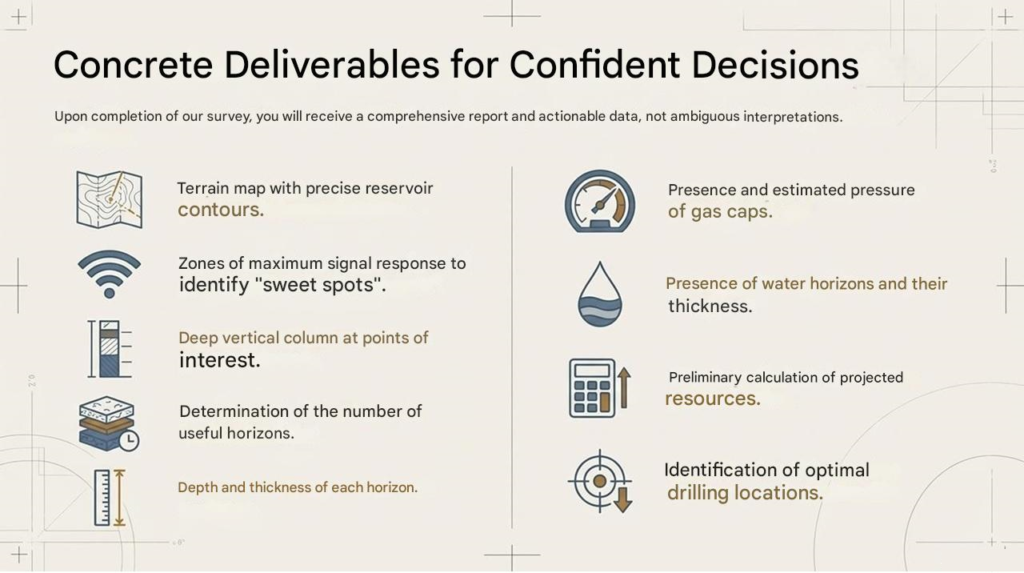
- A- The number of sweet spots and their percentages of the total surface area
- B- Important data on each sweet spot in the reservoir (depth, pressure, quantity)
- C- A traditional seismic plan can begin to be established (step 1). A traditional seismic can be start on ground or in sea
- D- if traditional seismic is developed the Human interpretation will do the decision for paas to apprasial well
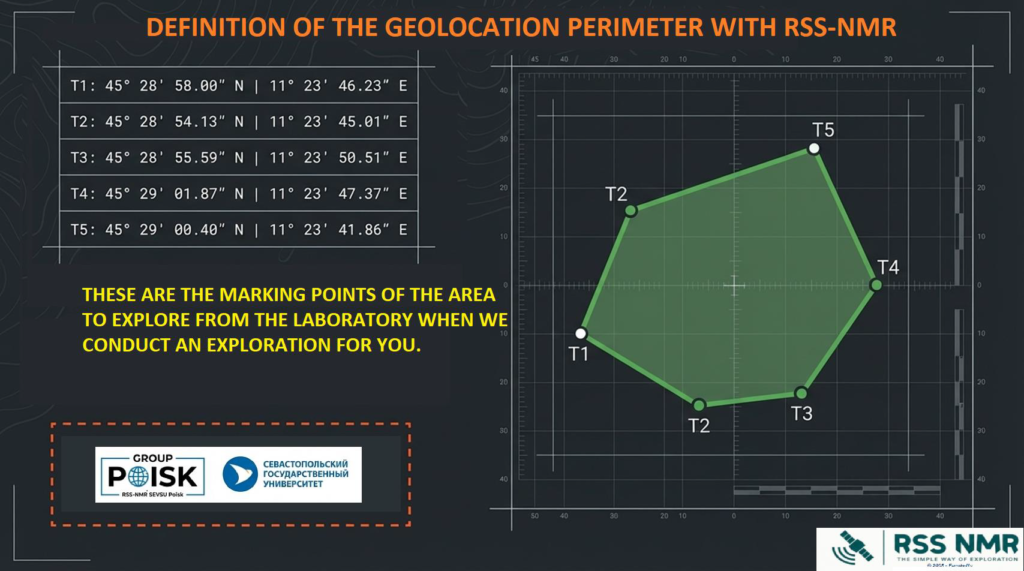
- E- Poisk always suggests the best location for drilling a test or apprasial well, providing longitude and latitude coordinates. Depths are indicated, as well as target thicknesses and many other characteristics.
13-If E&P wants to continue using traditional exploration methods
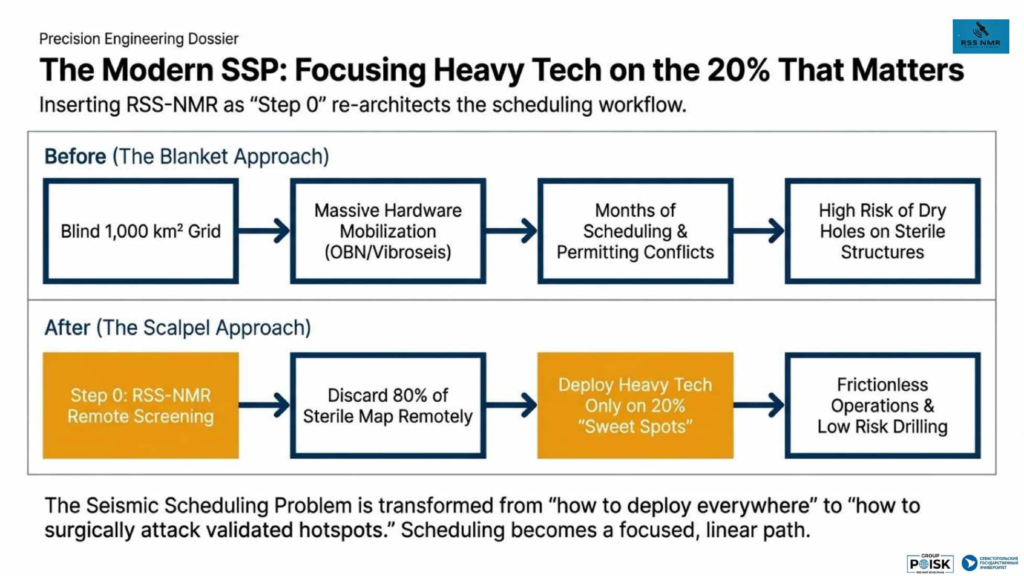
- Stage 1 -Traditional Seismic 2D-3D/ Stryde/ OBN / Focused MT: The deployment of heavy equipment is no longer systematic. The action becomes a “surgical attack” limited to the 10-20% of the surface where the fluids are already validated (the sweet points).
- Stage 2-Evaluation of the traditional seismic: itstakes the same duration of interpretationnand same costs
- Stage 3-Drilling: Drastic reduction in the risk of dry well and accelerated start-up to production.
13-A-A new era and immense technological progress for the exploration of new projects.
💻Synthèse : By including Step 0, the planner transforms seismic analysis from a blind financial constraint into a focused, high-yield tool. The “heavy” budget is only spent on anomalies in traditional seismic or sweet spot in Poisk Language.
💻Linguistic paradigm: “Translated”into the language of petroleum seismologists: we only proceed to Step 2 if fluids have been previously confirmed.
💻New technical frontier : The decision is made internally with a basic human interpretation, therefore there is less risk of drilling into a dry well.
14. The Ecology of Synergistic Exploration: The Impact Matrix
🔥Modern exploration is an ecology where each tool fulfills an optimal strategic function, minimizing the overall operational footprint. The initial groundwork is laid from the air, and the analytical work is carried out in our laboratories in Sevastopol.
🔥It has no ecological footprint during the Stage 0 and overall across a complete block; this stage 2 and 3 footprints will be reduced to the surface area of the identified sweet spots by the stage 0. This represents a percentage compared to systematic seismic surveys. The ecological impact is limited to that of traditional seismic surveys on sweet spots, even though we are able to design all the wells to be drilled.
15. Step Zero: The New Industry Standard
🔥Satellite filtering or more simply step Zero by RSS-NMR is no longer a technological option, it is a profitability imperative. The new exploration methodology is simple
“The question for the steering committee on new projects (Greenfield) should no longer be IF we should deploy RSS-NMR seismic surveys, but WHY we were deploying them in barren areas before. If this tool had appeared earlier, we would have saved money, time, and above all, we would have had a more robust production
🗺️Doing a lot of RSS-NMR explorations in various geographical continent that would have prevented historical disasters like the next fall of the petro-monarchies due to the Iran-U.S. War.”
“Pragmatism now dictates the use of Stage 0. It is the indispensable tool to guarantee absolute flexibility in the face of climatic and regulatory restrictions, definitively transforming structural exploration into fluid exploration by highlighting sweet spots and not by scanning the entire block or concession.
Satellite filtering or more simply step Zero by RSS-NMR is no longer a technological option, it is a profitability imperative. That´s before to 2A point of this presentation
16. Impact Exécutif et financier :
1-Drastic reduction in CapEx: Immediate release of tied-up capital.
2-Accelerated Time-to-Results: Elimination of logistical delays and overall acquisition timelines.
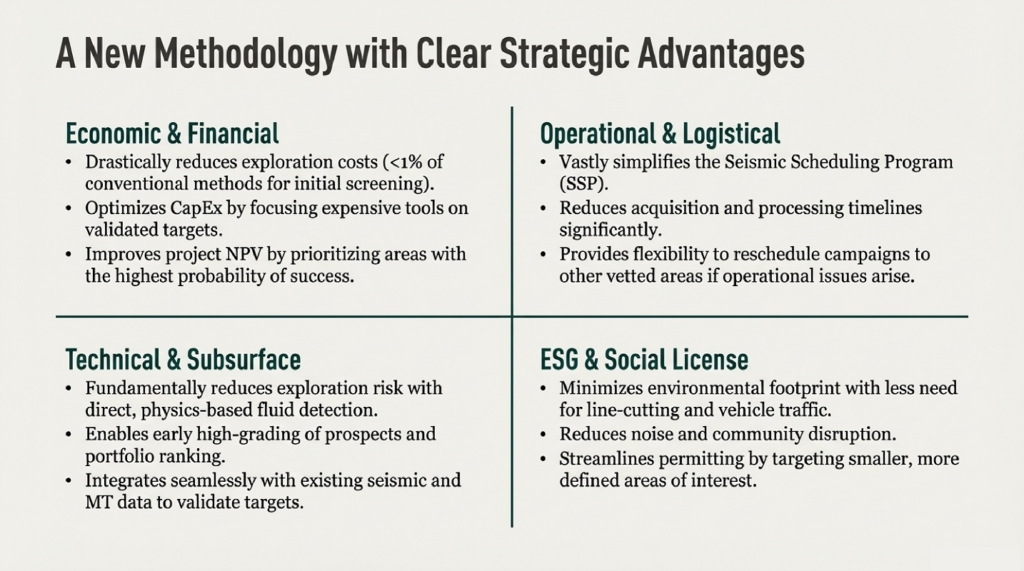
3-Operational flexibility: With a step 0, it’s possible to focus on several blocks or projects in different geographical areas simultaneously. If a systematic seismic survey is conducted directly, the focus is on a single project that can last from 18 months to 5 years.
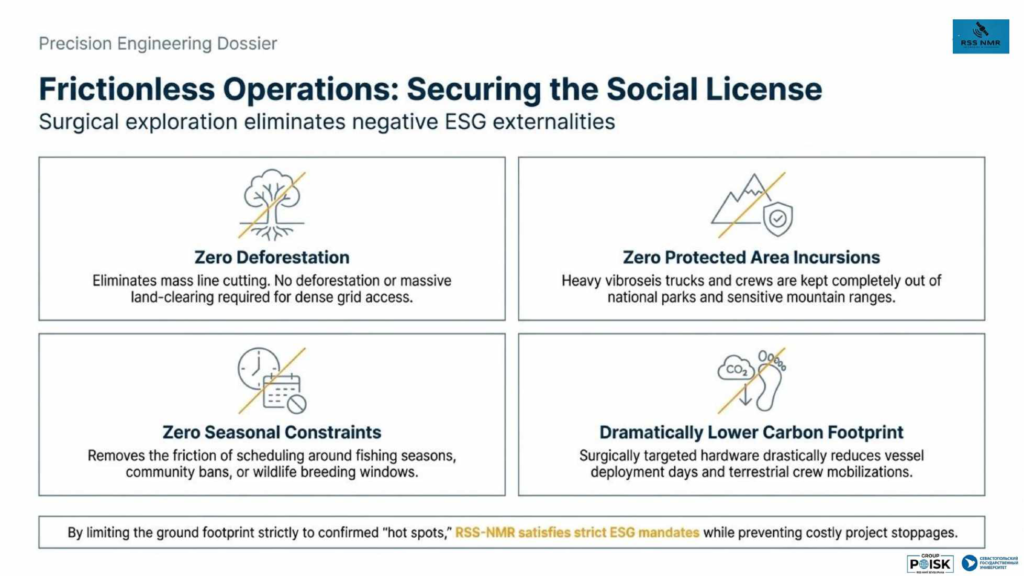
4-Total ESG Alignment for Stage Zero: no underwater seismic activity or explosions, onshore; no creation of camps or runways during Stage Zero, i.e., the RSS-NMR phase.,
5-Discretion and no visibility on the ground for Stage Zero: Since everything is done from space and in our laboratories in Sevastopol, we don’t need to apply for a global permit for the entire block; we’ll only apply for permits for the areas that have been identified the sweet spots. With the total absence of seismic personnel from the E&P (Engineering and Planning), it’s spy mode with the use of Stage Zero. No NGO´s protests, no blackmail from the local government.
6- When blocks are auctioned by an agency or government (especially in offshore areas): the blocks are studied by the RSS-NMR. If they have strong potential ( sweet spots able to be started in Production with a economical cost and easily exploitable “sweet spots,” they will be included in a preliminary model study to assess their potential and profitability before a decision is made to submit a bid.
7: If you wish to buy a block from a company, you can do two things without burdening the seller with this work:
I)- Verify if the existing potential that the company advertises is true.
II)- See if there are other sweet spots that were not detected during previous, older (2D) seismic surveys.
– On its own operating or abandoned blocks, this technology is key to revitalizing mature fields (brownfields). It allows for the identification of bypassed areas or peripheral deposits that went undetected during initial surveys conducted with the archaic seismic equipment of the time. This is done without interrupting ongoing production for a single second.
As a general rule, we advise repeating an RSS NMR exploration because we have often had pleasant surprises to announce to our clients who have been able to continue their older assets and developing new extension in the old asset by maintaining the permits on these older blocks, often by drilling one or two wells and using the export network to the tank farm or metering station before export via a collector pipeline.
17. Let’s talk costs and benefits because in oil and gas the Time is Money!
RSS-NMR costs 5%-10% of the price of a standard seismic survey, thus reducing costs, especially if the spots represent only a fraction of the entire block. The specific advantage of this zero-stage survey is that it reduces the cost and duration of a complete exploration (seismic survey and well drilling).
6To conduct a complete RSS-NMR study: we only need the points that mark the area to be observed and a prediction from your geologists.
💵Our cost is divided in two parts:
1- Fixed component: a project setup cost in our laboratories.
2- Variable component: a fixed cost per km², but if the area surveyed increases, the cost per km² decreases.
17A-Greenfield case Example A:
🗺️A junior company experiencing steady growth, with no oil reserves and low operating capital, but a dynamic and innovative workforce committed to the company’s success. This concrete example in West Africa is located onshore, in a 100% flat savanna area with no significant elevation changes, no rivers, ravines, or hills.
- The block covered 1280 km². If the E&P (Exploration & Production) company were to conduct a classical seismic survey at u$20,000/km², it would have cost u$25.6 millions.
- The company chose to implement a Stage Zero using RSS-NMR. The cost of Stage Zero (RSS-NMR) was $1.28 million (uS$1000.00/km²).
- This operation revealed that 17% of the total area, or 218 km² are 4 areas of interest or 4 sweet spots. These 218 km² cost only u$5.64 million.
🗺️Time is money: In 6-8 months, comprehensive documentation compiled following the initial assessment allows for the identification of all parameters needed to design well profiles. As a result, all logistics and, most importantly, costs have been reduced. It’s simple arithmetic.
17B-Greenfield case Example B:
Exemple concret : Refurbish d´un champ mature et abandonné limitrophe avec le greenfield de l’ exemple precedent
🗺️This field, which had previously produced, was examined by RSS-NMR, and there were two undetected sweet spots during the 1959 2D seismic survey. It is a field that has been abandoned for 12 years but has a complete and up-to-date permit since 1963 and is in good standing. It was symbolically acquired by the same junior company from a top 10 major. The permit covered 1093 km², which was abandoned for logistical reasons because it produced very little. Transporting the oil from the three wells to the tank farm at the port was very expensive.
- Stage Zero cost US$1,093,000 to identify 53% of the sweet spot, representing 580 km² outside the main reservoir, which was producing no more than 300 barrels/day before its closure.
Re-exploration of these 580 km² using 3D seismic surveys cost US$11.6 million.
Total 12,7 millions of dollars
The first well has been producing 4,200 barrels per day since July 2026; seven more wells remain to be brought into production on this neglected and abandoned permit.
1- with standard seismic searching for anomalies that will take two years to interpret, and instead search for the product (gas, oil, condensate, precious metals, deep water) DIRECTLY. In a short time, get the real answer to your question: YES or NO, are hydrocarbons present?
2- Before developing a new project (greenfield), re-explore your own mature fields (brownfield); there may be some pleasant surprises.
3- Before bidding higher in an oil block auction, take a “discreet” look at the block to see if it has potential; why buy barren blocks without hydrocarbons?
4- In the event of an acquisition or merger of E&P assets, check the existing potential, but especially and more important, the hidden potential of the seller’s block.
5-In the oil industry, it is important to have several projects well underway with fairly advanced preliminary studies (stage zero). One cannot predict the future in the event of policy changes and country risk. The problem between the US and Iran in the Strait of Hormuz is a good example. Many countries are looking for alternative supplies, but especially new production sites outside the Persian Gulf.
💵You have the OPPORTUNITY to have in your hands the ideal tool to make decisions that won’t put you in an awkward position.
18.Conclusions
- With Step Zero, you can perform a very rapid preliminary search at a fraction of the cost of the seismic survey you currently use.
- You can have several large projects examined AT THE SAME TIME very quickly thanks to Step Zero.
- You never fall under the control of a Ministry of Petroleum, a National Hydrocarbons Agency, or a state-owned company that wants you to pay to see (pay-to-see poker).
STAGE ZERO IN EXPLORATION
- The blocks to be auctioned, along with their coordinates (latitude and longitude), will be published in the press.
- Using these coordinates, you then conduct an RSS-NMR exploration, which will provide you with the optimal locations for the block(s) being auctioned.
- You no longer need to negotiate with the authorities to obtain an exploration permit (the “pay-to-play” approach). With RSS-NMR, you provide us with the coordinates (latitude and longitude) and the predicted depths, and we supply you with the Stage Zero report.
- Based on the results, you decide whether or not to apply for an exploration permit if you wish to conduct a conventional seismic survey, followed by a drilling permit.
- You can simultaneously apply this same process in different geographical areas to have a choice between various projects at the time of the final decision.
✅YOU NO LONGER “PAY FOR SEE” BECAUSE YOU KNOW BEFORE TO START TO SPEAK WITH AUTHORITIES WITH STAGE ZERO
18-B RE-EXPLORATION OF YOUR OWN MATURE FIELDS
⛏️Before abandoning an oil field, it is wise to check if any reservoirs were overlooked during previous seismic events. This field, which is legally up-to-date at the time of the RSS-NMR observation, will provide the expected answer. Either the permit is renewed if there is still potential, or the concession is returned if it will be depleted very quickly. Once again, the effort involved in obtaining the permit cost money; it must be exploited to the fullest.
⛏️Also his mature field, or one that should be abandoned, must be relocated within the zone. There may be a forgotten reservoir ( new or to be re developped) like ideal neighbor, and it’s better to keep a field already covered by a permit with all its documentation up to date. Furthermore, continue to make the equipment profitable.
18-C EXPLORATION OR RE-EXPLORATION IN CASE TO BUY AN ASSET WITH PERMIT
⛏️Always do a RSS-NMR exploration to a prospect (new field or field already in operation) that you want to buy is done before financial negotiations. This allows you to see the potential being developed by the seller, but also to explore the entire field to see if there are any other reservoirs.
18-D-RESUME ABOUT THE POSSIBILITIES OF USE OF THE TECHNOLOGY